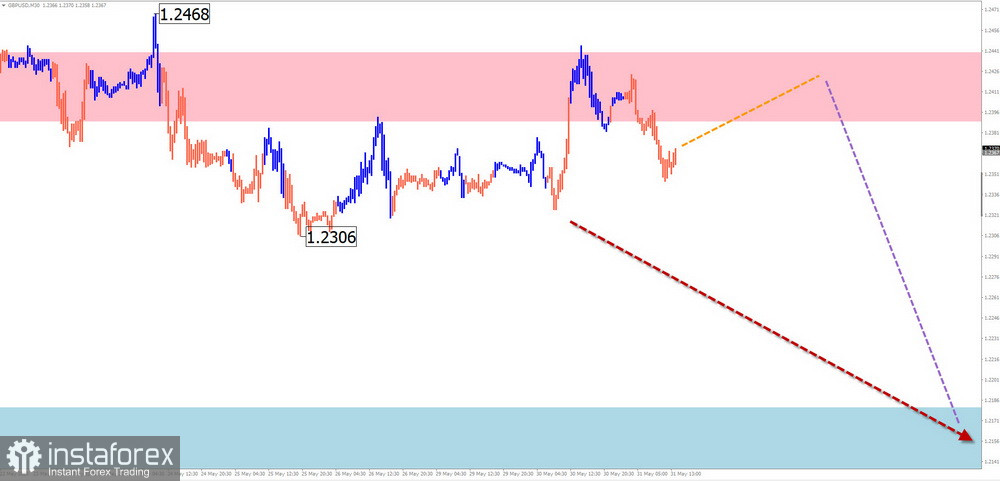
In the nearest weekly period, the continuation of the overall sideways movement of the British pound is expected. In the first few days of the week, an ascending vector is possible, but not above the upper boundary of the resistance zone.
GBP/USD
Analysis:
The major trend of the British pound has been directed "north" on the price chart since March of this year. Since the beginning of April, the price has been drifting. The final part of the correction still needs to be completed. The price broke through the intermediate support level on the daily time frame. For the price wave to continue, it must consolidate below this zone.
Forecast:
In the nearest weekly period, the continuation of the overall sideways movement of the British pound is expected. In the first few days of the week, an ascending vector is possible, but not above the upper boundary of the resistance zone. Afterward, a reversal and a decrease in price towards support can be expected. Further downward breakthrough is unlikely.
Potential Reversal Zones
Resistance:
Support:
Recommendations:
Selling: Possible with reduced lot size. Signals for selling are best tracked near the calculated resistance. The potential is limited by support.
Buying: Risky for the deposit.
AUD/USD
Analysis:
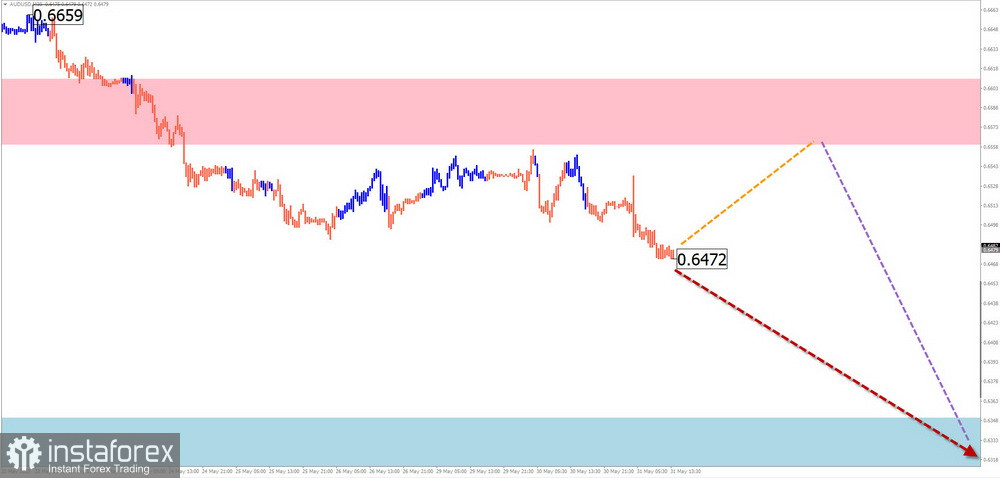
Since October of last year, a rising wave zigzag has been forming on the weekly scale of the Australian dollar chart. The ongoing corrective section has been counting from the beginning of this year. The last section of the correction still needs to be completed. The price broke through strong support in the last decade and rebounded upwards, forming a correction. After its completion, the price decline will continue.
Forecast:
In the coming week, an ascending movement vector is likely in the first few days. The highest probability of reversal and change is expected near the calculated resistance. The highest activity is expected towards the end of the week. The support zone represents the lower boundary of the expected weekly move for the pair.
Potential Reversal Zones
Resistance:
Support:
Recommendations:
Selling: In the next few days, possible with a reduced trading lot within individual sessions from the resistance zone.
Buying: In the next few days, this may result in losses for the deposit. It is best to refrain from such transactions.
USD/CHF
Analysis:
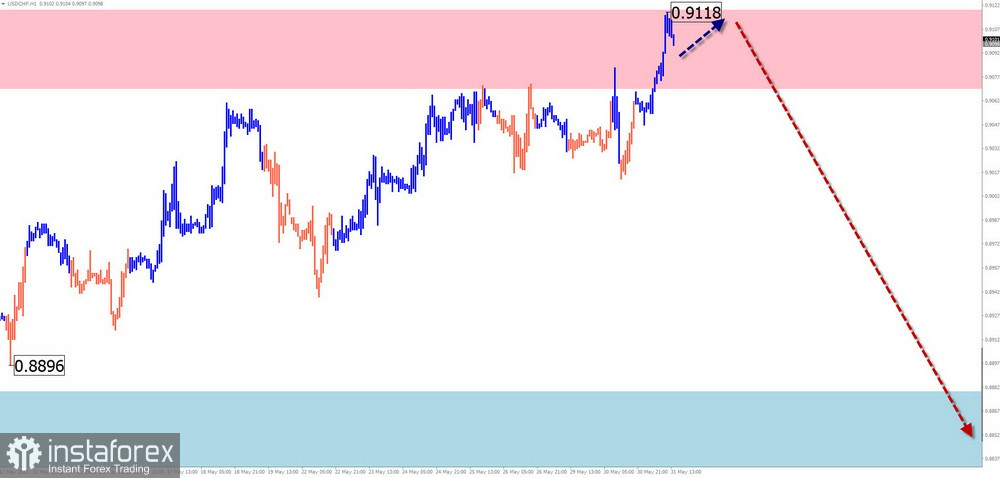
Within the dominant bearish wave of the Swiss franc major, the pair's price reached the boundaries of the potential reversal zone on the weekly time frame. In the last two months, the price has been drifting between the boundaries of this zone, forming a horizontal corridor. At the time of analysis, the upward price retracement is approaching completion, nearing its upper boundary.
Forecast:
Attempts to pressure the resistance are likely at the beginning of the week. In the following days, a reversal formation can be expected. However, a brief breach of the upper boundary of the zone cannot be ruled out. The resumption of the decline can be expected closer to the end of the week.
Potential Reversal Zones
Resistance:
Support:
Recommendations:
Buy: There are no conditions for such trades.
Sell: Similar trades may result in losses until confirmed reversal signals appear near the resistance zone.
EUR/JPY
Analysis:
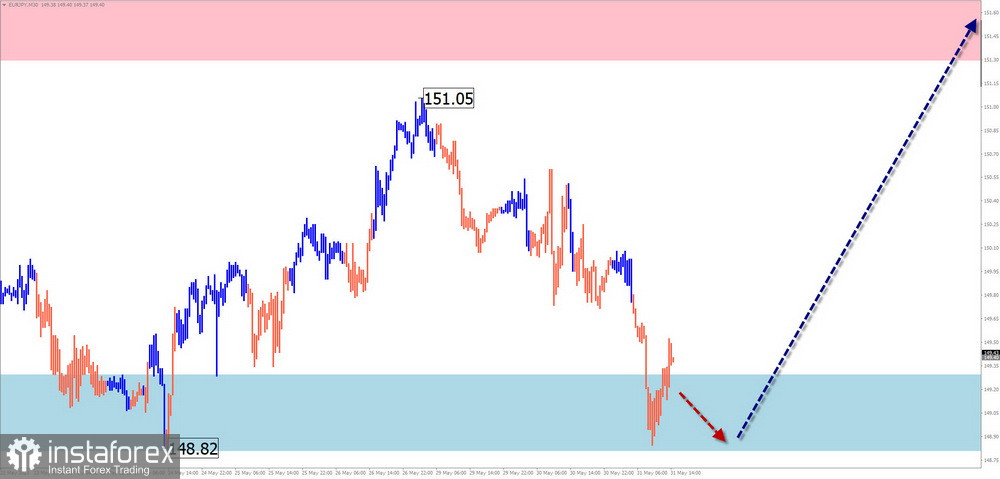
In the short-term perspective of the euro/Japanese yen cross pair, a descending wave algorithm has set the trend direction since May 2nd. The wave's middle part (B) is nearing completion in its structure. The price has reached the potential reversal zone of the daily chart. There are no imminent signals of a direction change.
Forecast:
A general flat price movement is expected at the beginning of the upcoming week. The first few days will predominantly have a bullish vector. In the second half of the week, there is a high probability of increased volatility, reversal, and resumption of the downtrend. The boundaries of the expected price movement show the levels of calculated zones in the opposite direction.
Potential Reversal Zones
Resistance:
Support:
Recommendations:
Buy: Possible only within separate sessions with fractional lot sizes. The potential is limited by resistance.
Sell: Premature until reversal signals appear near the resistance zone.
#Ethereum
Analysis:
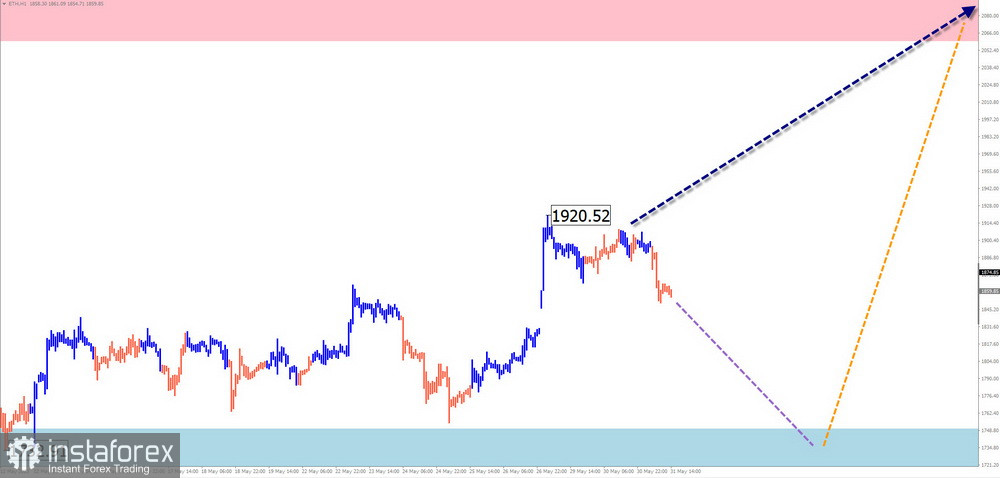
On the Ethereum chart, a horizontal extended flat has formed since June last year. Analysis of the structure indicates the completion of the final part (C) of this wave. The descending segment since April 14th has reversal potential. Upon confirmation, the downtrend will resume.
Forecast:
In the upcoming week, the ongoing sideways movement is expected to continue. A short-term descending vector is possible but not below the support zone. Towards the end of the following week, the probability of a trend reversal and a resumption of the cryptocurrency's price growth increases.
Potential Reversal Zones
Resistance:
Support:
Recommendations:
Buy: This will become possible after the appearance of reversal signals in the calculated termination zone.
Sell: Can be used within separate sessions with fractional lot sizes. The potential is limited by support.
US Dollar Index
Analysis:
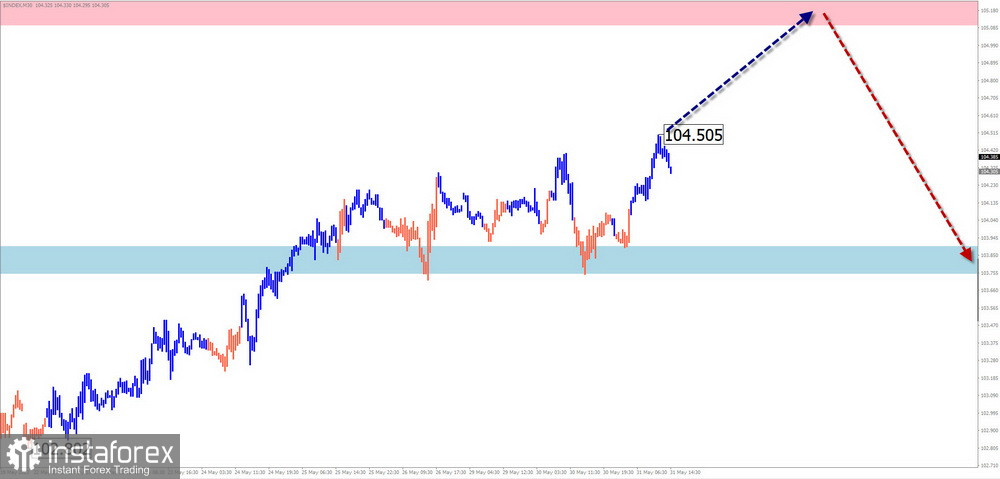
Within the dominant bearish wave of the US dollar index since February, an incomplete corrective bullish wave is developing on the chart at the time of analysis. The quotes on the chart form a shifting flat. At the time of analysis, the price broke through strong resistance, consolidating above it for further growth.
Forecast:
The overall upward vector of the index is expected to continue in the upcoming week. After a possible decrease toward the support zone, renewed price growth can be expected. The resistance zone represents the next probable zone for the completion of the current wave.
Potential Reversal Zones
Resistance:
Support:
Recommendations:
The strengthening of the US dollar continues. The movement is entering its final stage. After the upcoming further strengthening of its position, there is a high probability of a trend reversal.
Note: In simplified wave analysis (SWA), all waves consist of 3 parts (A-B-C). The latest incomplete wave is analyzed on each time frame. Dotted lines represent expected movements.
Attention: The wave algorithm does not consider the duration of instrument movements over time!