signal strength 2 of 5
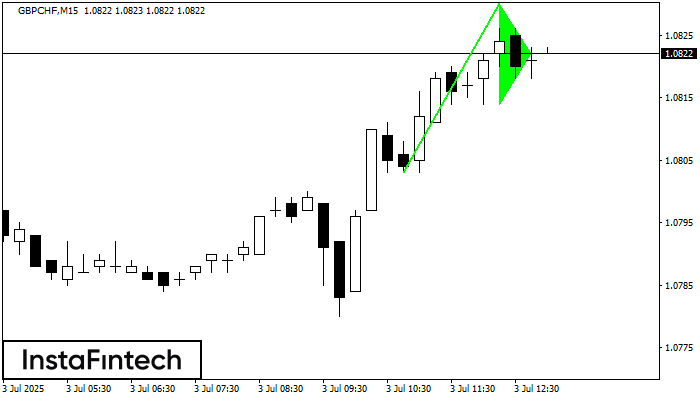
The Bullish pennant graphic pattern has formed on the GBPCHF M15 instrument. This pattern type falls under the category of continuation patterns. In this case, if the quote can breaks out high, is expected to continue the upward trend to level 1.0853.
The M5 and M15 time frames may have more false entry points.
See Also
- All
- Double Top
- Flag
- Head and Shoulders
- Pennant
- Rectangle
- Triangle
- Triple top
- All
- #AAPL
- #AMZN
- #Bitcoin
- #EBAY
- #FB
- #GOOG
- #INTC
- #KO
- #MA
- #MCD
- #MSFT
- #NTDOY
- #PEP
- #TSLA
- #TWTR
- AUDCAD
- AUDCHF
- AUDJPY
- AUDUSD
- EURCAD
- EURCHF
- EURGBP
- EURJPY
- EURNZD
- EURRUB
- EURUSD
- GBPAUD
- GBPCHF
- GBPJPY
- GBPUSD
- GOLD
- NZDCAD
- NZDCHF
- NZDJPY
- NZDUSD
- SILVER
- USDCAD
- USDCHF
- USDJPY
- USDRUB
- All
- M5
- M15
- M30
- H1
- D1
- All
- Buy
- Sale
- All
- 1
- 2
- 3
- 4
- 5
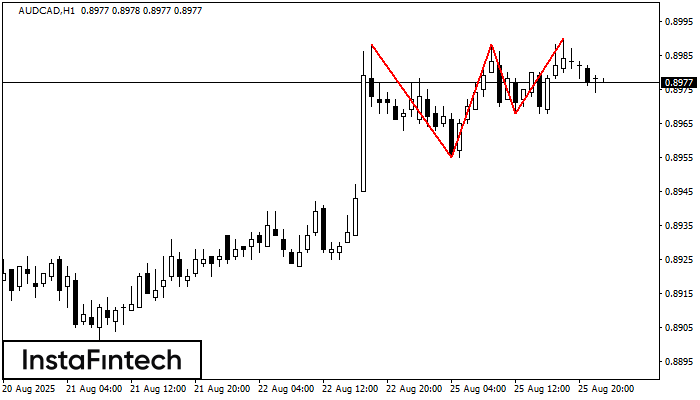
On the chart of the AUDCAD H1 trading instrument, the Triple Top pattern that signals a trend change has formed. It is possible that after formation of the third peak
Open chart in a new window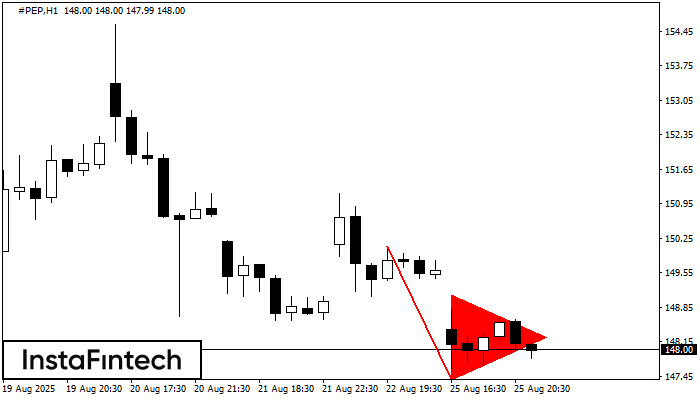
The Bearish pennant pattern has formed on the #PEP H1 chart. It signals potential continuation of the existing trend. Specifications: the pattern’s bottom has the coordinate of 147.37; the projection
Open chart in a new window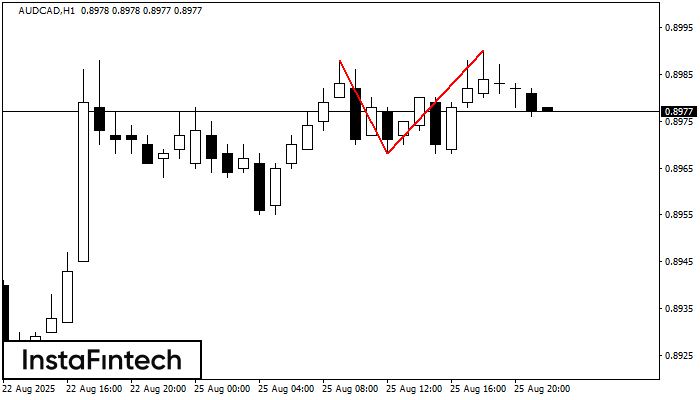
The Double Top reversal pattern has been formed on AUDCAD H1. Characteristics: the upper boundary 0.8988; the lower boundary 0.8968; the width of the pattern is 22 points. Sell trades
Open chart in a new window