signal strength 2 of 5
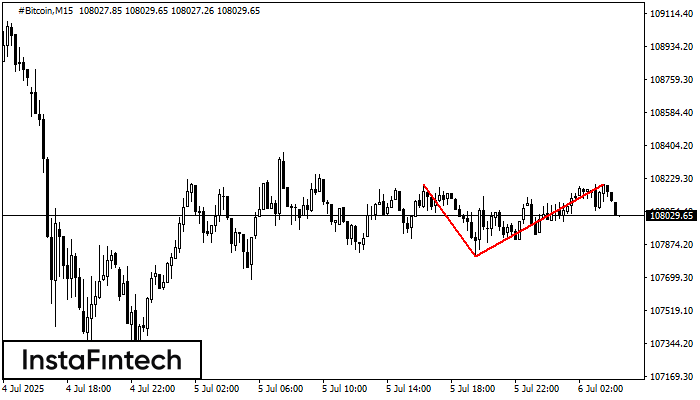
On the chart of #Bitcoin M15 the Double Top reversal pattern has been formed. Characteristics: the upper boundary 108196.50; the lower boundary 107810.44; the width of the pattern 38606 points. The signal: a break of the lower boundary will cause continuation of the downward trend targeting the 107810.20 level.
The M5 and M15 time frames may have more false entry points.
See Also
- All
- Double Top
- Flag
- Head and Shoulders
- Pennant
- Rectangle
- Triangle
- Triple top
- All
- #AAPL
- #AMZN
- #Bitcoin
- #EBAY
- #FB
- #GOOG
- #INTC
- #KO
- #MA
- #MCD
- #MSFT
- #NTDOY
- #PEP
- #TSLA
- #TWTR
- AUDCAD
- AUDCHF
- AUDJPY
- AUDUSD
- EURCAD
- EURCHF
- EURGBP
- EURJPY
- EURNZD
- EURRUB
- EURUSD
- GBPAUD
- GBPCHF
- GBPJPY
- GBPUSD
- GOLD
- NZDCAD
- NZDCHF
- NZDJPY
- NZDUSD
- SILVER
- USDCAD
- USDCHF
- USDJPY
- USDRUB
- All
- M5
- M15
- M30
- H1
- D1
- All
- Buy
- Sale
- All
- 1
- 2
- 3
- 4
- 5
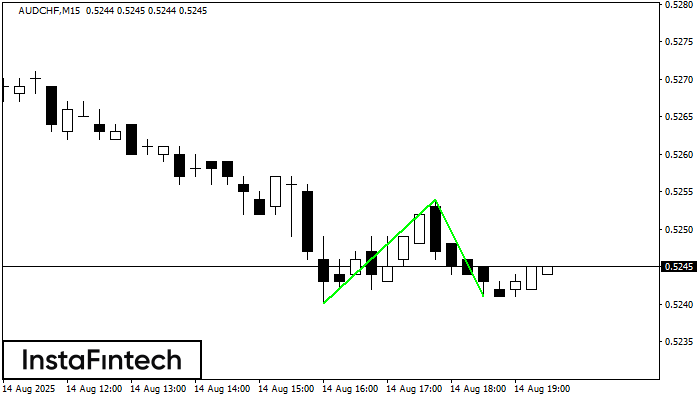
The Double Bottom pattern has been formed on AUDCHF M15; the upper boundary is 0.5254; the lower boundary is 0.5241. The width of the pattern is 14 points. In case
The M5 and M15 time frames may have more false entry points.
Open chart in a new window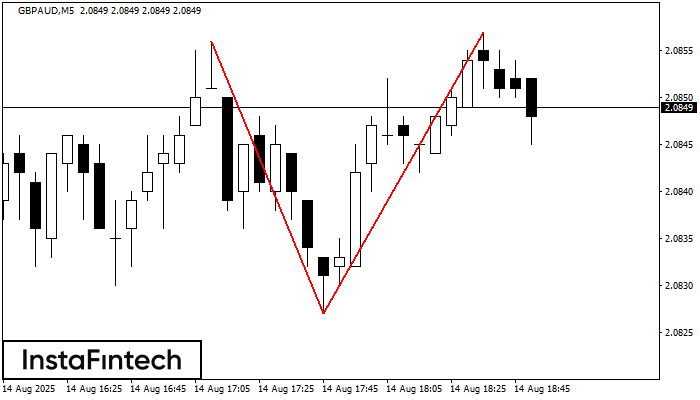
The Double Top pattern has been formed on GBPAUD M5. It signals that the trend has been changed from upwards to downwards. Probably, if the base of the pattern 2.0827
The M5 and M15 time frames may have more false entry points.
Open chart in a new window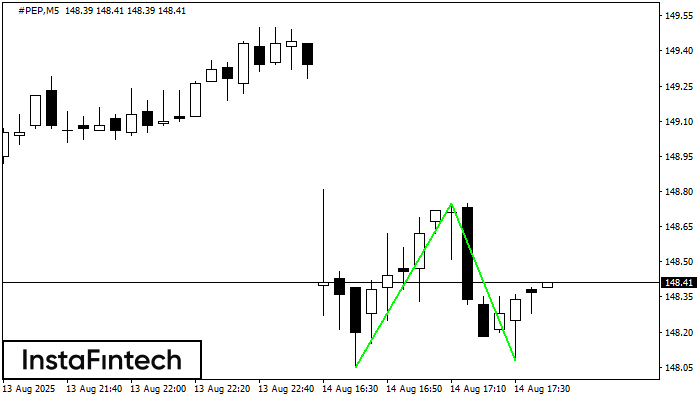
The Double Bottom pattern has been formed on #PEP M5. This formation signals a reversal of the trend from downwards to upwards. The signal is that a buy trade should
The M5 and M15 time frames may have more false entry points.
Open chart in a new window