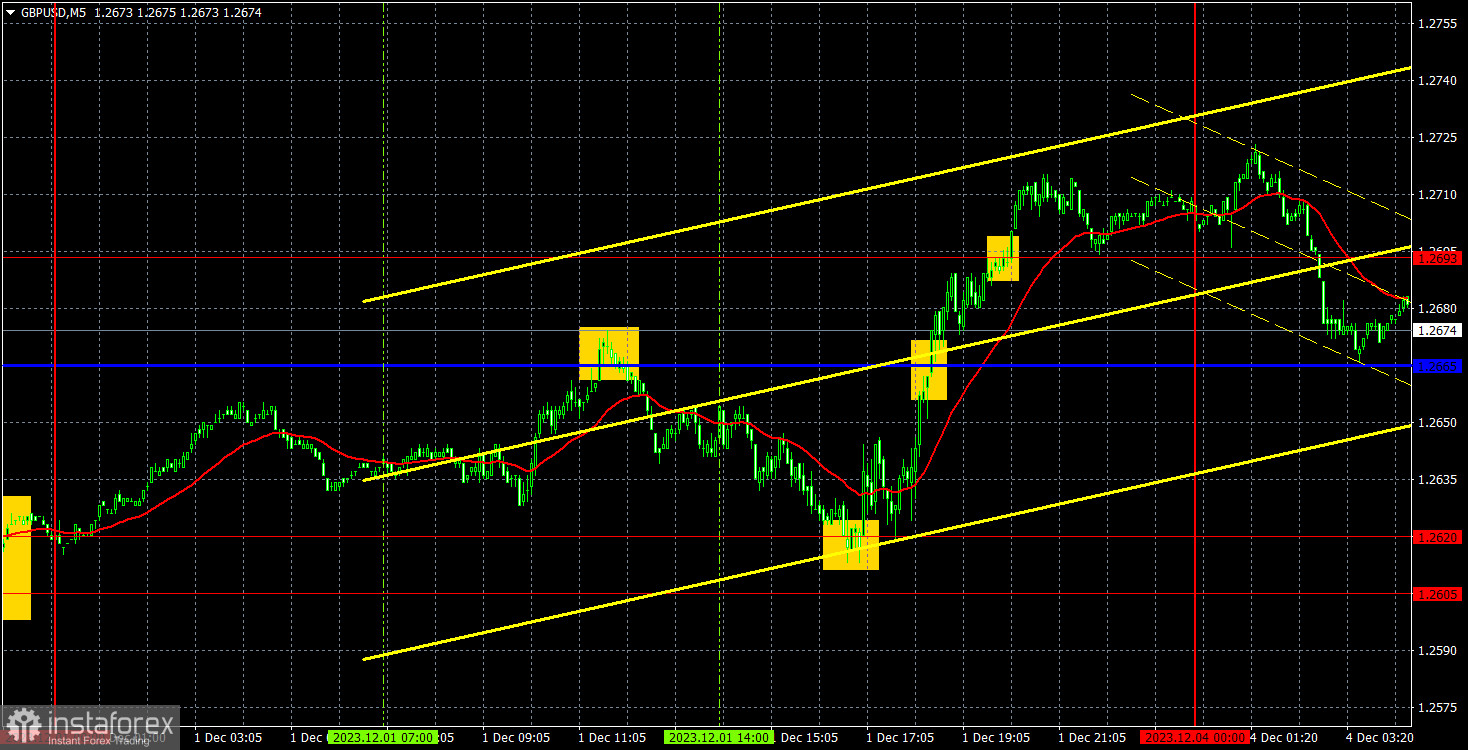
Analysis of GBP/USD 5M
GBP/USD also attempted to correct lower on Friday, but it had a much more challenging time compared to the euro. At one point, the price dropped to the level of 1.2620 and bounced back from it. Meanwhile, the U.S. ISM Manufacturing Purchasing Managers' Index was published, which turned out to be weaker than forecasts, and Federal Reserve Chairman Jerome Powell also delivered a speech. In our opinion, Powell did not say anything that was exceptionally substantial for the market. Nevertheless, the market was busy getting rid of the dollar. Powell did not adhere to either hawkish or dovish rhetoric during his speech, so we do not believe that the dollar should have fallen. However, we have been waiting for the end of the uptrend for the last three weeks, and during this time, the British pound has been rising almost without any pronounced corrective movements and almost continuously at that. Therefore, there is a bit of a priori logic in the market's reaction at the moment.
Speaking of trading signals, they were quite interesting and good. Initially, the pair rebounded from a critical line and dropped to the level of 1.2620. Then, it bounced back from the level of 1.2620 and rose above the level of 1.2693. In general, we expected these two signals to work out, and both turned out to be profitable, earning around 80-90 pips.
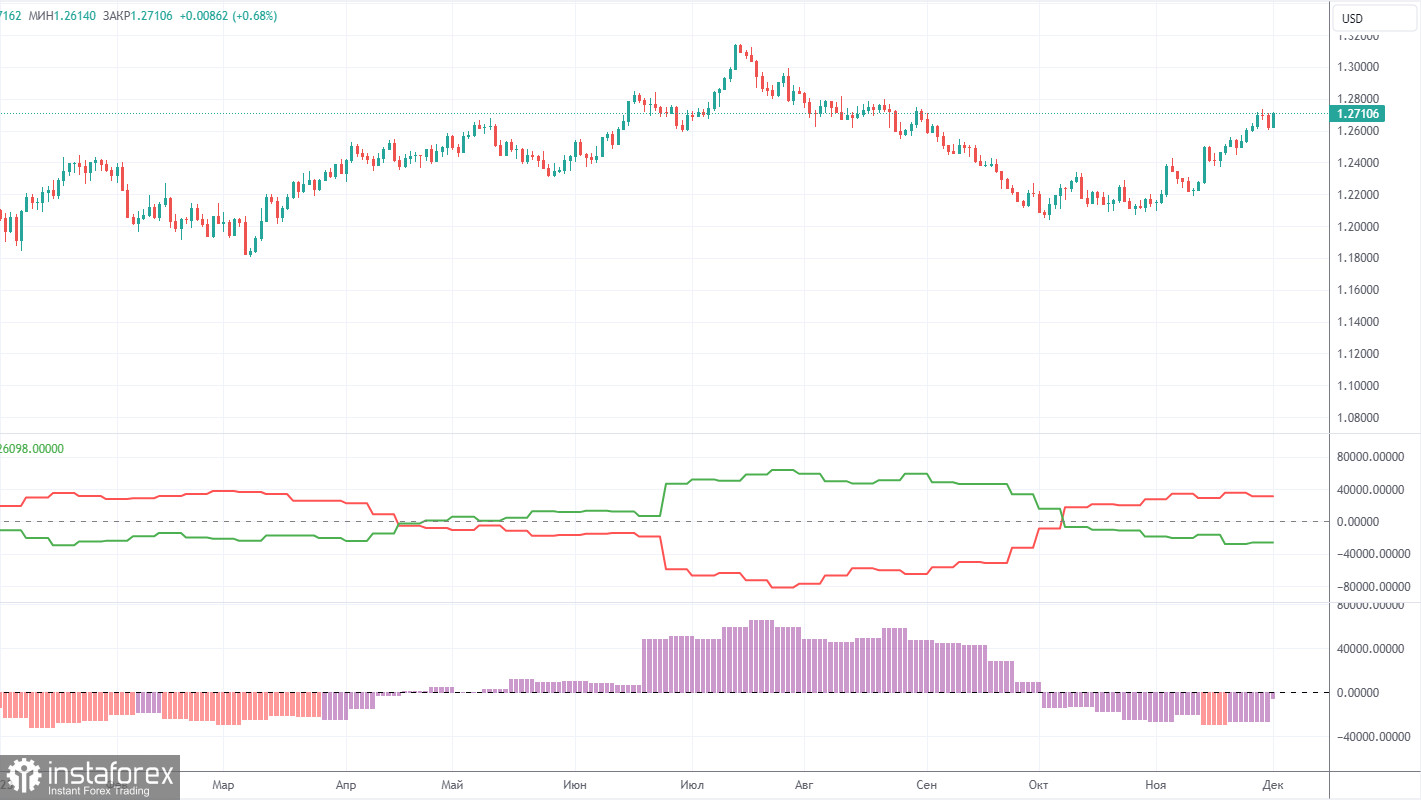
COT report:
COT reports on the British pound also align perfectly with what's happening in the market. According to the latest report on GBP/USD, the non-commercial group opened 18,000 long positions and closed 200 short ones. Thus, the net position of non-commercial traders increased by another 18,200 contracts in a week. The net position indicator has been steadily rising over the past 12 months, but it has been firmly decreasing since August. In recent weeks, the pound has traded higher, and large players are gradually increasing their long positions. However, we still believe that the pound will start a pronounced downward movement.
The British pound has surged by a total of 2,800 pips from its absolute lows reached last year, which is an enormous increase. Without a strong downward correction, a further upward trend would be entirely illogical (if it is even planned). We don't rule out an extension of an uptrend. We simply believe that a substantial correction is needed first, and then we should assess the factors supporting the US dollar and the British pound. A correction to the level of 1.1844 would be enough to establish a fair balance between the two currencies. The non-commercial group currently holds a total of 61,300 longs and 69,200 shorts. In general, there is currently a balance between bulls and bears.
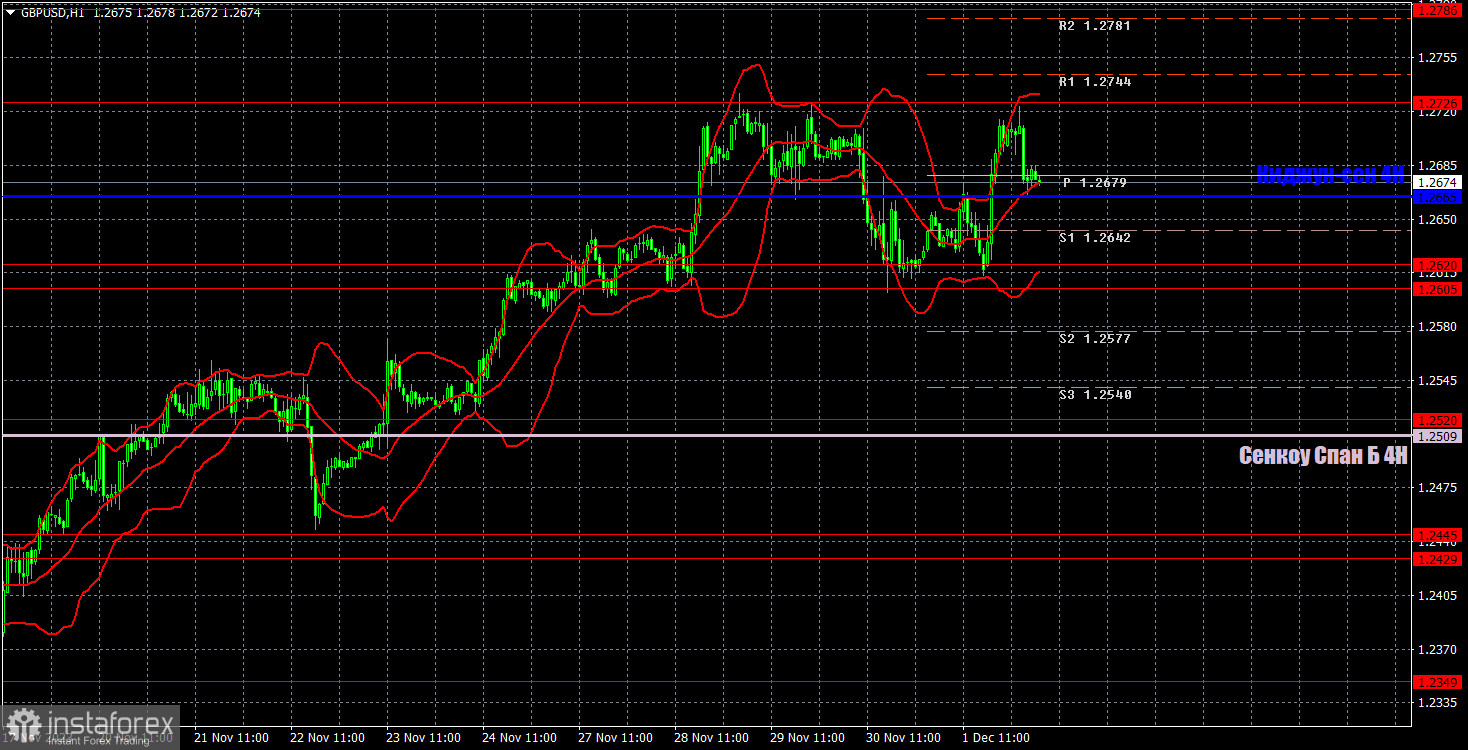
Analysis of GBP/USD 1H
On the 1H chart, GBP/USD continues its short-term uptrend and is currently above all Ichimoku indicator lines. Therefore, there is no sign that the uptrend is over. We expect the pound to fall and consider it excessive and illogical for the pair to continue its upward movement. However, the market believes otherwise, so this type of movement may persist.
Today, we recommend paying attention to the Kijun-sen line, as the pair is currently trading around this area. A bounce from it can be used to open longs with 1.2726 as the target or even slightly higher. If the price consolidates below this line, traders can sell the pair with 1.2620 as the target.
As of December 4, we highlight the following important levels: 1.1927-1.1965, 1.2052, 1.2109, 1.2215, 1.2269, 1.2349, 1.2429-1.2445, 1.2520, 1.2605-1.2620, 1.2726, 1.2786, 1.2863. The Senkou Span B (1.2509) and Kijun-sen (1.2665) lines can also be sources of signals. Signals can be "bounces" and "breakouts" of these levels and lines. It is recommended to set the Stop Loss level to break-even when the price moves in the right direction by 20 pips. The Ichimoku indicator lines can move during the day, which should be taken into account when determining trading signals. The illustration also includes support and resistance levels that can be used to lock in profits from trades.
On Monday, there are no significant events lined up in either the United States or the United Kingdom. Therefore, we shouldn't expect trends or good volatility. The absence of significant events does not guarantee a flat, but there's a good chance that we will witness a flat phase today. In particular, the pair may spend the entire day near the critical line, regularly crossing it. You should leave the market at the first signs of a flat.
Description of the chart:
Support and resistance levels are thick red lines near which the trend may end. They do not provide trading signals;
The Kijun-sen and Senkou Span B lines are the lines of the Ichimoku indicator, plotted to the 1H timeframe from the 4H one. They provide trading signals;
Extreme levels are thin red lines from which the price bounced earlier. They provide trading signals;
Yellow lines are trend lines, trend channels, and any other technical patterns;
Indicator 1 on the COT charts is the net position size for each category of traders;
Indicator 2 on the COT charts is the net position size for the Non-commercial group.