empty
29.05.2023 04:14 AM
How to trade GBP/USD on May 29. Simple trading tips and analysis for beginners

Analyzing Friday's trades:

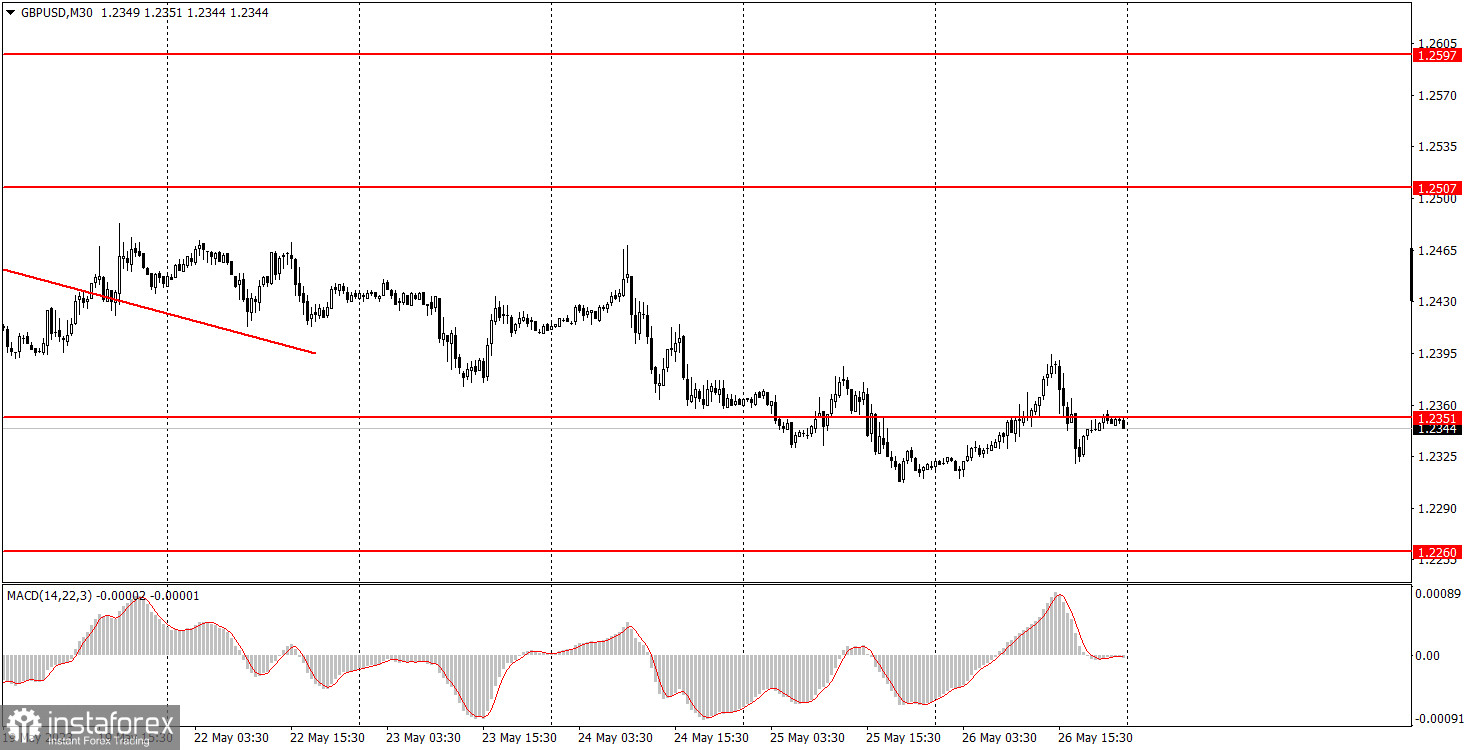
GBP/USD on 30M chart

This image is no longer relevant

On Friday, the GBP/USD pair moved in exactly the same way as the EUR/USD pair. The pound traded higher in the first half of the day, an attempt to correct against the current downtrend. It fell during the second half of the day after the release of US macro data and eventually returned to its initial positions closer to the evening. The only addition was the UK retail sales data, which was published early in the morning and turned out to be stronger than forecasts. This could have provided an additional boost to the bulls, explaining the pound's growth. However, later on, US data were released, which can be considered neutral overall. The most important report on durable goods orders surprised traders as it turned out to be 2.2% above forecasts, resulting in the dollar's growth. But overall, Friday's movements did not have any impact on the overall technical picture. Although there is currently no trend line, the downtrend is unquestionable.
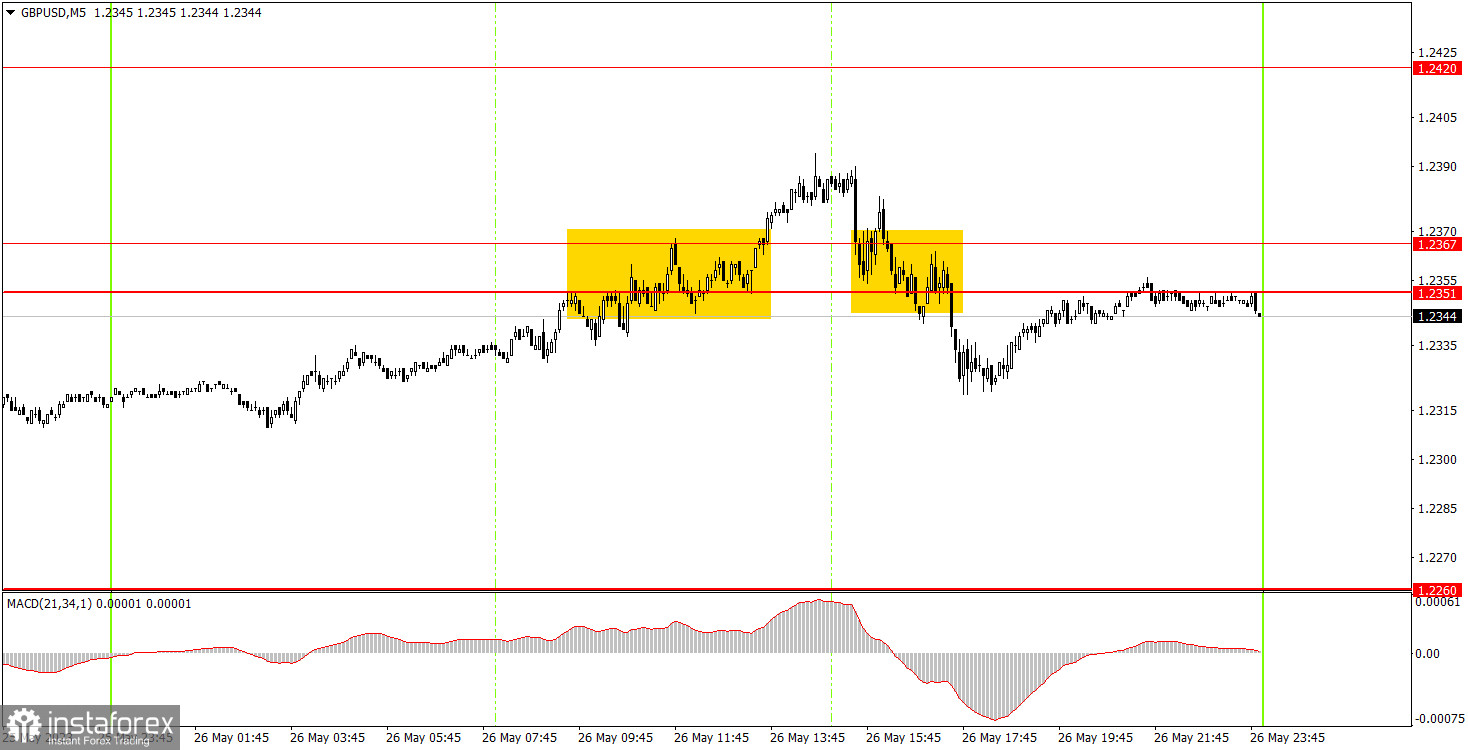
GBP/USD on 5M chart

This image is no longer relevant

Two trading signals were formed on the 5-minute chart, and both left much to be desired. First, the pair fell below the range of 1.2351-1.2367, and then it climbed above it. Beginners were lucky that the volatility on Friday was slightly higher than in the previous days of the week, so in both cases, the price managed to move 20 pips in the right direction, which was enough to set the Stop Loss at breakeven. Consequently, both trades should have closed at breakeven without losses. Take note that the pair's movements are currently weak and movement comes with frequent pullbacks and corrections. Trading in such conditions can be quite challenging.

Trading tips on Monday:

As seen on the 30M chart, the GBP/USD pair tried to break the downtrend, but failed. The British pound is currently falling under any circumstances, which fully aligns with our view of the situation. The pair rose for two months for no clear reasons, and now it is time for a reversal, which also doesn't require significant justifications. The key levels on the 5M chart are 1.2171-1.2179, 1.2245-1.2260, 1.2351-1.2367, 1.2420, 1.2470, 1.2507-1.2520, 1.2597-1.2616. When the price moves 20 pips in the right direction after opening a trade, a stop loss can be set at breakeven. There are no important events or reports scheduled for Monday in the UK or the US. We can expect the day to be absolutely dull unless we receive some discouraging news. Volatility will probably be low, and there may be no intraday trend.

Basic rules of the trading system:

1) The strength of the signal depends on the time period during which the signal was formed (a rebound or a break). The shorter this period, the stronger the signal.

2) If two or more trades were opened at some level following false signals, i.e. those signals that did not lead the price to Take Profit level or the nearest target levels, then any consequent signals near this level should be ignored.

3) During the flat trend, any currency pair may form a lot of false signals or do not produce any signals at all. In any case, the flat trend is not the best condition for trading.

4) Trades are opened in the time period between the beginning of the European session and until the middle of the American one when all deals should be closed manually.

5) We can pay attention to the MACD signals in the 30M time frame only if there is good volatility and a definite trend confirmed by a trend line or a trend channel.

6) If two key levels are too close to each other (about 5-15 pips), then this is a support or resistance area.

How to read charts:

Support and Resistance price levels can serve as targets when buying or selling. You can place Take Profit levels near them.

Red lines are channels or trend lines that display the current trend and show which direction is better to trade.

MACD indicator (14,22,3) is a histogram and a signal line showing when it is better to enter the market when they cross. This indicator is better to be used in combination with trend channels or trend lines.

Important speeches and reports that are always reflected in the economic calendars can greatly influence the movement of a currency pair. Therefore, during such events, it is recommended to trade as carefully as possible or exit the market in order to avoid a sharp price reversal against the previous movement.

Beginners should remember that every trade cannot be profitable. The development of a reliable strategy and money management are the key to success in trading over a long period of time.

Paolo Greco,
Analytical expert of InstaForex
© 2007-2025
Select timeframe
5
min
15
min
30
min
1
hour
4
hours
1
day
1
week
Earn on cryptocurrency rate changes with InstaForex
Download MetaTrader 4 and open your first trade
  • Grand Choice
    Contest by
    InstaForex
    InstaForex always strives to help you
    fulfill your biggest dreams.
    JOIN CONTEST

Recommended Stories

GBP/USD: Trading Plan for the U.S. Session on June 10th (Review of Morning Trades)

In my morning forecast, I drew attention to the 1.3545 level and planned to base market entry decisions on it. Let's look at the 5-minute chart to see what happened

Miroslaw Bawulski 18:26 2025-06-10 UTC+2

EUR/USD: Trading Plan for the U.S. Session on June 10th (Review of Morning Trades)

In my morning forecast, I highlighted the level of 1.1388 and planned to make market entry decisions based on it. Let's take a look at the 5-minute chart

Miroslaw Bawulski 18:22 2025-06-10 UTC+2

How to Trade the GBP/USD Pair on June 10? Simple Tips and Trade Analysis for Beginners

Analysis of Monday's Trades 1H Chart of GBP/USD The GBP/USD pair also traded in both directions on Monday. On Friday, the price consolidated below the ascending trendline, formally changing

Paolo Greco 06:40 2025-06-10 UTC+2

How to Trade the EUR/USD Pair on June 10? Simple Tips and Trade Analysis for Beginners

Analysis of Monday's Trades 1H Chart of EUR/USD The EUR/USD currency pair traded with low volatility and in both directions on Monday. That day, the macroeconomic backdrop was practically absent

Paolo Greco 06:40 2025-06-10 UTC+2

Trading Recommendations and Analysis for GBP/USD on June 10: The Pound Is in No Hurry to Fall Either

On Monday, the GBP/USD currency pair predictably failed to continue its downward movement. Recall that earlier, the price again formed a signal for a trend reversal to bearish—a consolidation below

Paolo Greco 04:11 2025-06-10 UTC+2

Trading Recommendations and Analysis for EUR/USD on June 10: Another Day, Another Dose of Negativity

The EUR/USD currency pair traded mixed throughout Monday. Despite breaking through the trendline, the downward movement (i.e., strengthening the US dollar) never actually began. Thus, technical signals still hold little

Paolo Greco 04:11 2025-06-10 UTC+2

GBP/USD: Trading Plan for the U.S. Session on June 9th (Analysis of Morning Trades)

In my morning forecast, I focused on the 1.3581 level and planned to base entry decisions around it. Let's look at the 5-minute chart and see what happened. The rise

Miroslaw Bawulski 14:16 2025-06-09 UTC+2

EUR/USD: Trading Plan for the U.S. Session on June 9th (Analysis of Morning Trades)

In my morning forecast, I focused on the 1.1430 level and planned to base entry decisions around it. Let's look at the 5-minute chart and see what happened. The pair

Miroslaw Bawulski 14:09 2025-06-09 UTC+2

How to Trade the GBP/USD Pair on June 9? Simple Tips and Trade Analysis for Beginners

Analysis of Friday's Trades 1H Chart of GBP/USD The GBP/USD pair also traded lower on Friday for the same reasons as the EUR/USD pair. The dollar received minimal market support

Paolo Greco 05:54 2025-06-09 UTC+2

How to Trade the EUR/USD Pair on June 9? Simple Tips and Trade Analysis for Beginners

Analysis of Friday's Trades 1H Chart of EUR/USD The EUR/USD currency pair traded lower on Friday, and there were objective reasons for this. However, it's important to note that

Paolo Greco 05:54 2025-06-09 UTC+2
Can't speak right now?
Ask your question in the chat.
Widget callback
 

Dear visitor,

Your IP address shows that you are currently located in the USA. If you are a resident of the United States, you are prohibited from using the services of InstaFintech Group including online trading, online transfers, deposit/withdrawal of funds, etc.

If you think you are seeing this message by mistake and your location is not the US, kindly proceed to the website. Otherwise, you must leave the website in order to comply with government restrictions.

Why does your IP address show your location as the USA?

  • - you are using a VPN provided by a hosting company based in the United States;
  • - your IP does not have proper WHOIS records;
  • - an error occurred in the WHOIS geolocation database.

Please confirm whether you are a US resident or not by clicking the relevant button below. If you choose the wrong option, being a US resident, you will not be able to open an account with InstaForex anyway.

We are sorry for any inconvenience caused by this message.