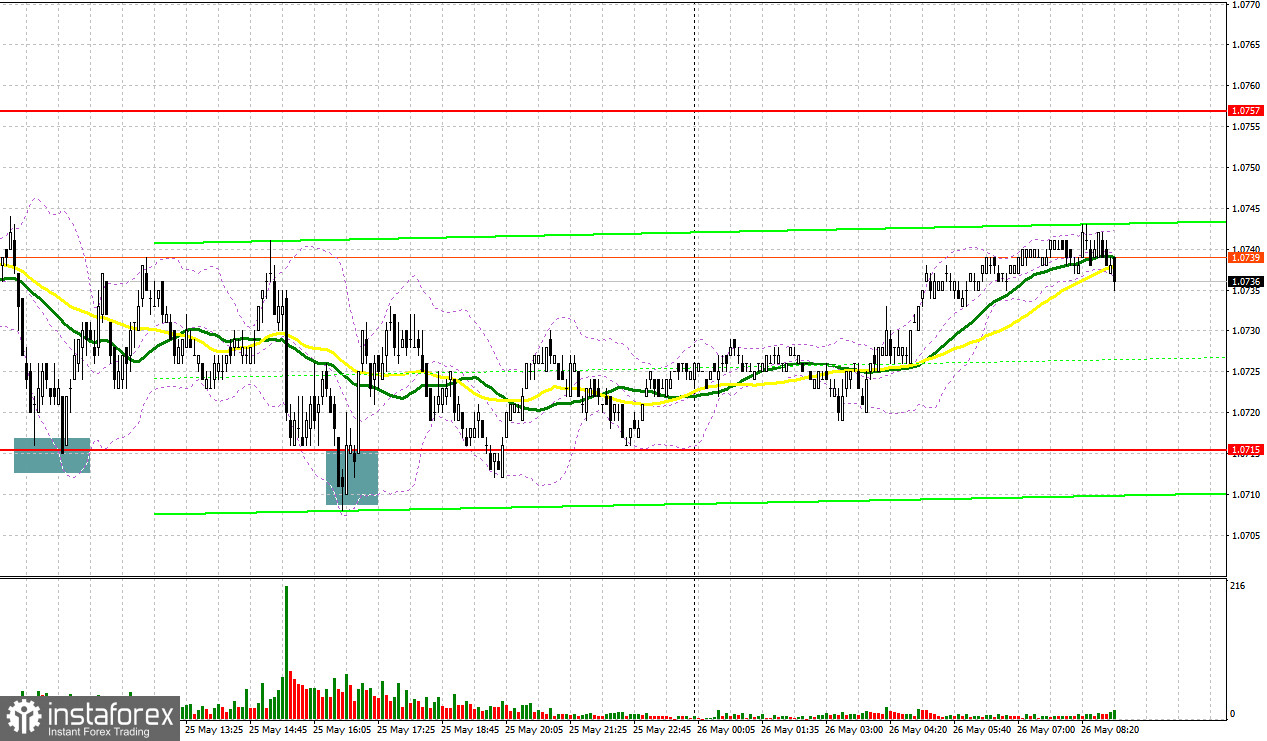
Yesterday, there were several entry points. Now, let's look at the 5-minute chart and figure out what actually happened. In my morning article, I turned your attention to 1.0715 and recommended making decisions with this level in focus. A decline and a false breakout of this level gave entry points into long positions, which resulted in an increase of about 20 pips. There was a similar entry point in the afternoon. The upward movement also amounted to about 20 pips.
When to open long positions on EUR/USD:
The upwardly revised GDP for the 1st quarter maintained pressure on the euro, triggering a further decline in the EUR/USD pair. Today, apart from the speech of ECB Executive Board Member Philipp Plein, the economic calendar is almost empty. So, the pressure on the pair in the morning may persist. Given that ECB policymakers have made lots of statements about monetary policy, there is a chance for a correction of the euro at the end of the week. It is better to make a decision only after a decline and a false breakout of a new monthly low of 1.0715. It will indicate that there are large traders in the market who want to push the euro higher against the bearish trend. It could create new entry points into long positions. The pair may grow to the resistance level of 1.0757 where the moving averages are passing in negative territory. A breakout and a downward retest of this level amid weak US reports will boost demand for the euro closer to the afternoon, providing an additional entry point into long positions. The pair is likely to reach 1.0795. A more distant target will be the 1.0833 level where I recommend locking in profits.
If EUR/USD declines and bulls fail to defend 1.0715, which is more likely in such a bear market, the bearish trend will continue. Therefore, only a false breakout of the support level of 1.0674 will create new entry points into long positions. You could buy EUR/USD at a bounce from a low of 1.0634, keeping in mind an upward intraday correction of 30-35 pips.
When to open short positions on EUR/USD:
Bears continue to control the market. Protecting the resistance level of 1.0757 remains the main priority and a suitable scenario for opening short positions in the continuation of the trend. A false breakout of this level will give a sell signal that may push the pair to the monthly low of 1.0715. Consolidation below this level as well as an upward retest will trigger a decline to 1.0674. A more distant target will be the 1.0634 level I recommend locking in profits. If EUR/USD rises during the European session and bears show no energy at 1.0757, a correction may take place. In this case, I would advise you to postpone short positions until a false breakout of 1.0795. You could sell EUR/USD at a bounce from a high of 1.0833, keeping in mind a downward intraday correction of 30-35 pips.
COT report
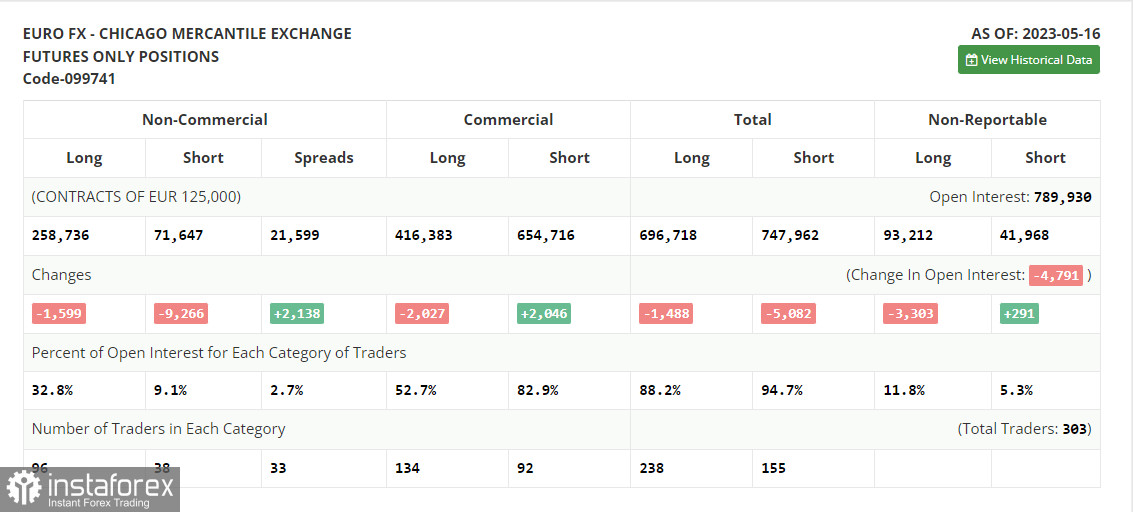
According to the COT report for May 16, there was a decline in long and short positions. However, a drop in short ones turned out to be larger. The corrective downward movement of the euro that occurred last week created excellent entry points into long positions. As long as US lawmakers do not reach an agreement on the debt ceiling, demand for risky assets is likely to remain low. Traders are even ignoring the statements of Fed policymakers, who hinted at a pause at the next meeting. This is a bullish factor for the euro. So, when the Biden administration and Congress strike a deal on the debt ceiling, bulls will return to the market. The COT report showed that long non-commercial positions decreased by only 1,599, to 258,736, while short non-commercial positions tumbled by 9,266 to 71,647. At the end of the week, the total non-commercial net position grew to 187,089 against 179,422. The weekly closing price declined to 1.0889 against 1.0992.
Indicators' signals:
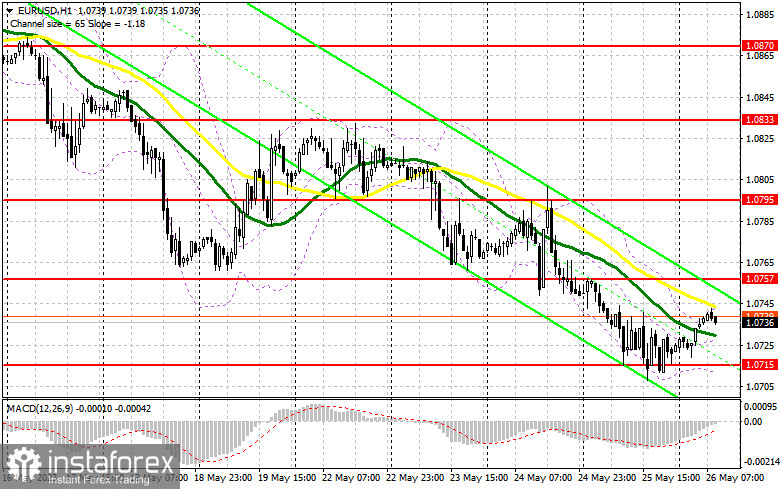
Trading is carried out below the 30 and 50 daily moving averages, which indicates a further downward movement.
Moving averages
Note: The period and prices of moving averages are considered by the author on the H1 (1-hour) chart and differ from the general definition of the classic daily moving averages on the daily D1 chart.
Bollinger Bands
If EUR/USD declines, the indicator's lower border at 1.0715 will serve as support.
Description of indicators
- Moving average (moving average, determines the current trend by smoothing out volatility and noise). Period 50. It is marked yellow on the chart.
- Moving average (moving average, determines the current trend by smoothing out volatility and noise). Period 30. It is marked green on the chart.
- MACD indicator (Moving Average Convergence/Divergence - convergence/divergence of moving averages) Quick EMA period 12. Slow EMA period to 26. SMA period 9
- Bollinger Bands (Bollinger Bands). Period 20
- Non-commercial speculative traders, such as individual traders, hedge funds, and large institutions that use the futures market for speculative purposes and meet certain requirements.
- Long non-commercial positions represent the total long open position of non-commercial traders.
- Short non-commercial positions represent the total short open position of non-commercial traders.
- Total non-commercial net position is the difference between the short and long positions of non-commercial traders.