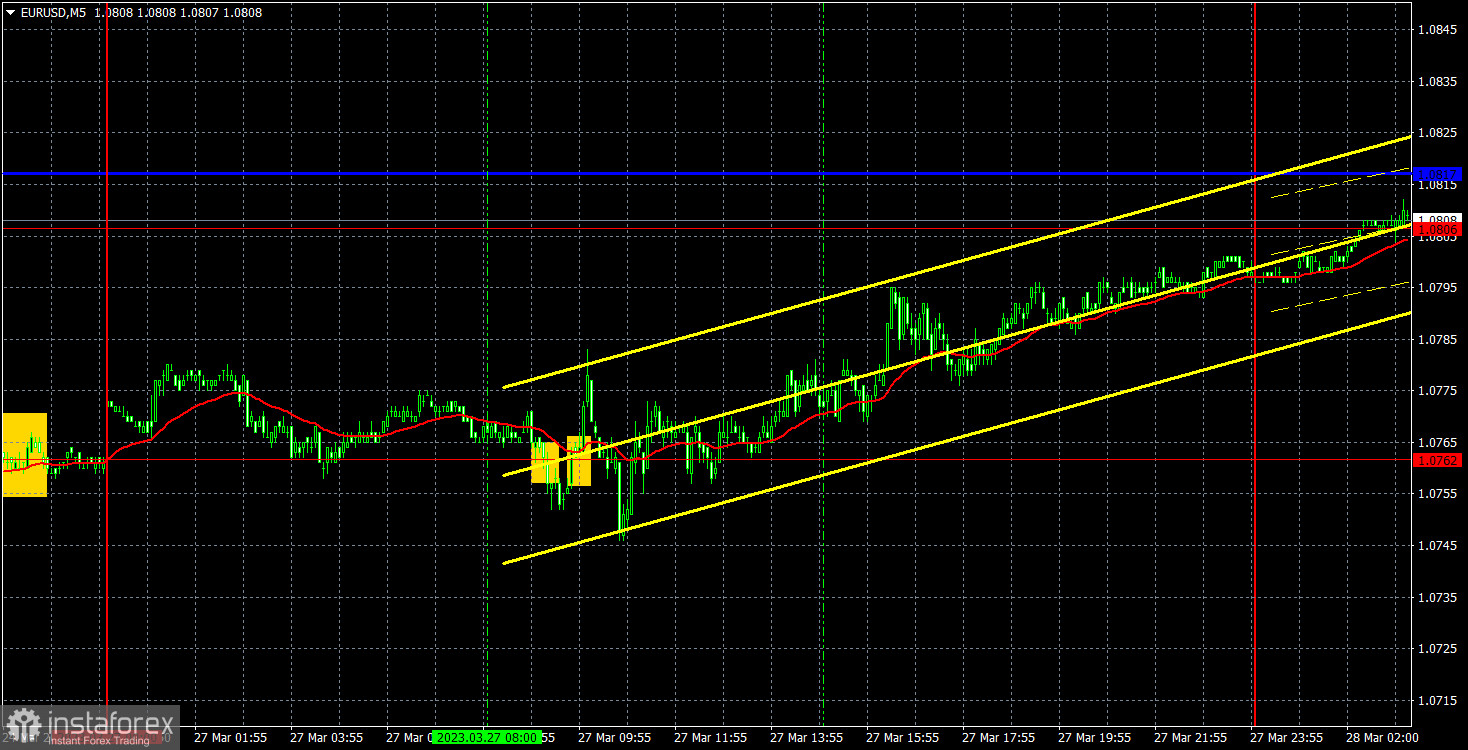
empty
28.03.2023 08:43 AM
EUR/USD: Forecast and trading signals on March 28. COT report. Detailed analysis of price movement and trades. The euro aims to rise

5M chart of EUR/USD

This image is no longer relevant

On Monday, EUR/USD quietly started a new round of upward movement, despite overcoming the ascending trend line. So far this movement can be considered as an upward pullback, but settling above the critical line is likely to restore the uptrend. Once again, we're facing a situation where the euro might be rising for no reason. Yesterday, there were no important events or reports in the US and the EU. In our fundamental articles, we tried to explain why the pair might continue rising (which does not seem logical), but it does not change the fact that the upward movement still looks strange in any time frame. Thus, a rebound from the Kijun-Sen line can still provoke the fall, but the USD has been feeling out of place lately.

There is not much to say about Monday's trading signals. During the European trading session, the pair started "dancing" near 1.0762, having formed several false signals. So traders could try to use the first two, which didn't bring them any profit, just a loss. Although, the loss was not as big as to how low volatility was during the day. But then again it was still a loss. Unfortunately, if the movement is weak or it moves up or down like a swing, then you can't expect any profit...
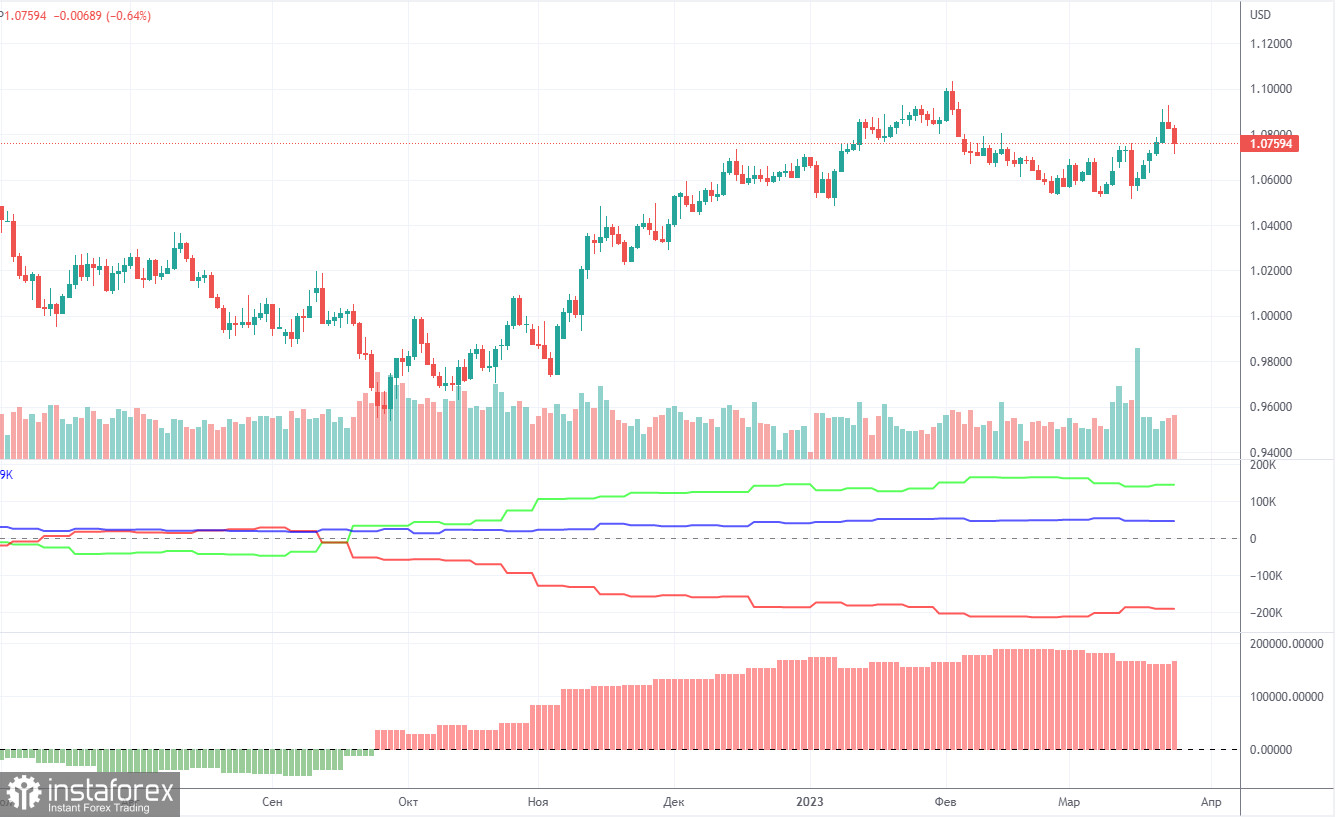
COT report:

This image is no longer relevant

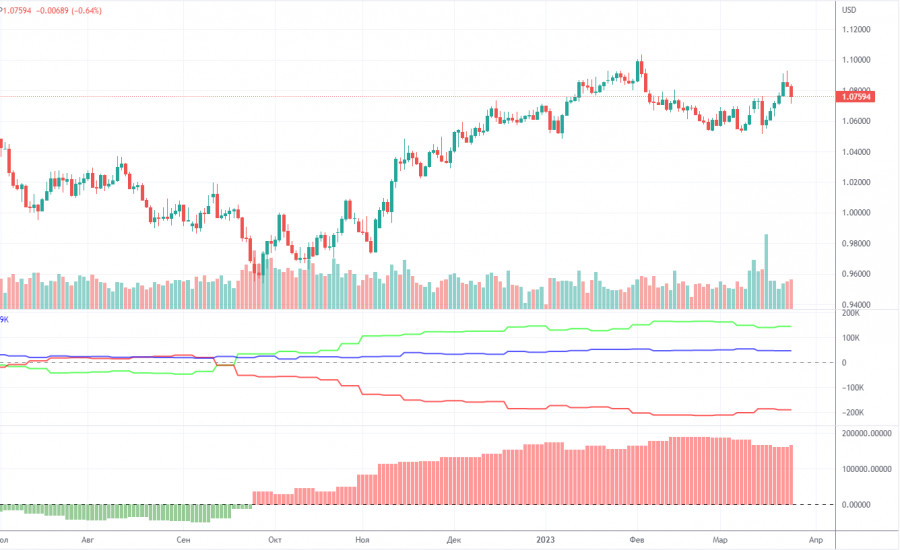
On Friday, the new COT report for March 21 was released. The Commodity Futures Trading Commission has caught up with the lost time and has now released reports exactly on time. In the last few months, the picture was completely consistent with what was happening in the market. On the chart above, we see that the net non-commercial position of large traders (second indicator) has risen since September 2022. At about the same time, the euro started to rise. The net non-commercial position is bullish and only started to fall during the last couple of weeks, which coincides with the euro's decline. I have already drawn your attention to the fact that a fairly high value of the "net position" allows us to expect the uptrend to stop shortly. Such a signal comes from the first indicator, with the green line and the red line being far apart, which is usually a sign of the end of a trend. The euro has already started to fall, but we don't know if it's just a bearish correction or a new downtrend. According to the latest report, non-commercial traders closed 6,500 long positions, while the number of short ones decreased by 11,300. Consequently, the net position rose by 4,800. The number of long positions exceeds that of short ones by 145,000. In any case, a correction has been looming for a long time. Therefore, even without reports, it is clear that the downtrend will continue.
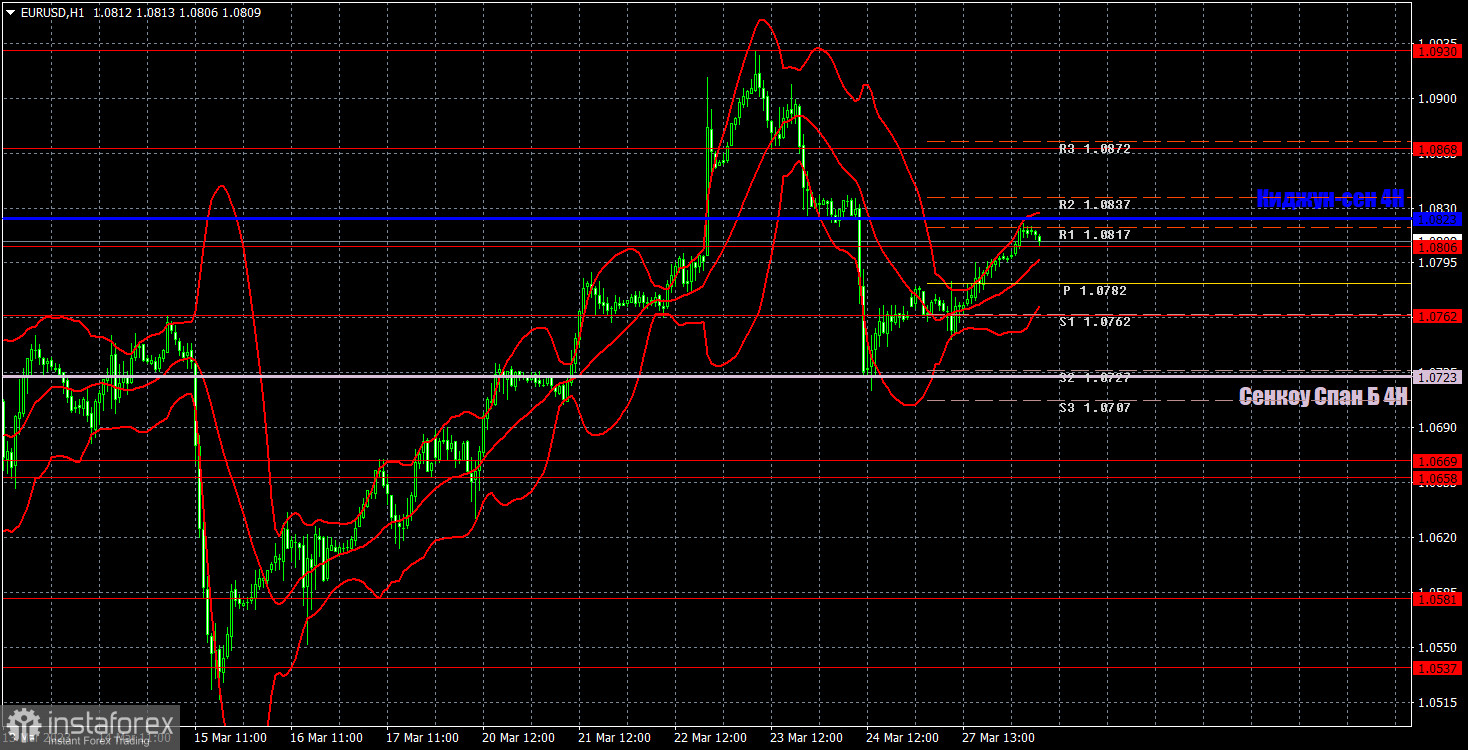
1H chart of EUR/USD

This image is no longer relevant

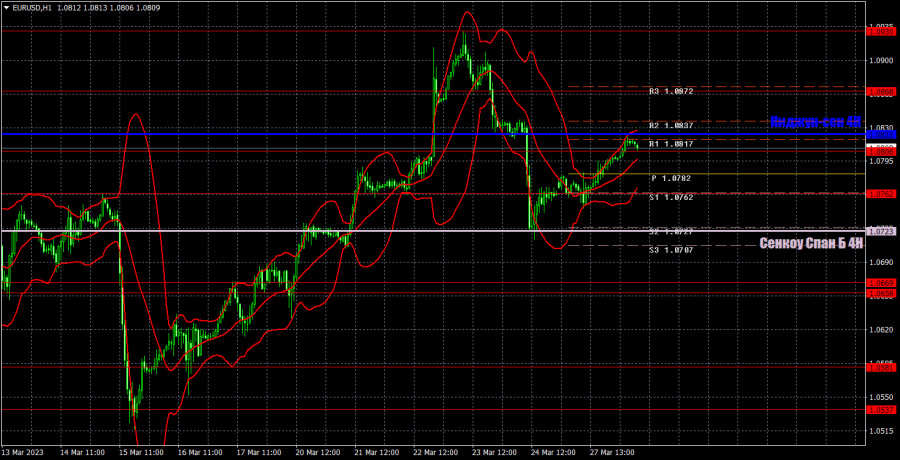
On the one-hour chart, EUR/USD had been rising for six straight days, entered a correction, but is now heading upwards again. So far, the price is above the Senkou Span B line, but below the Kijun-Sen. The nearest target is the Senkou Span B line. However, overcoming the critical line will bring back the bulls to the market, and with a completely empty calendar of events, the euro can resume growth. Therefore, all hope is on the Kijun-Sen. On Tuesday, important levels are seen at .0537, 1.0581, 1.0658-1.0669, 1.0762, 1.0806, 1.0868, 1.0938, 1.1033, 1.1137-1.1185 as well as the Senkou Span B (1.0723) and Kijun Sen (1.0823) lines. Ichimoku indicator lines can move intraday, which should be taken into account when determining trading signals. There are also support and resistance although no signals are made near these levels. They could be made when the price either breaks or rebounds from these extreme levels. Do not forget to place Stop Loss at the breakeven point when the price goes by 15 pips in the right direction. In case of a false breakout, it could save you from possible losses. On March 28, there are no important events or reports planned in the European Union or the United States. There's nothing to react to, so it is likely that we will have a weak movement, which will be very difficult to work out. We are focusing on the "technique" again.

Indicators on charts:

Resistance/support - thick red lines, near which the trend may stop. They do not make trading signals.

Kijun-sen and Senkou Span B are the Ichimoku indicator lines moved to the hourly timeframe from the 4-hour timeframe. They are also strong lines.

Extreme levels are thin red lines, from which the price used to bounce earlier. They can produce trading signals.

Yellow lines are trend lines, trend channels, and any other technical patterns.

Indicator 1 on the COT chart is the size of the net position of each trader category.

Indicator 2 on the COT chart is the size of the net position for the Non-commercial group of traders.

Paolo Greco,
Analytical expert of InstaForex
© 2007-2025
Select timeframe
5
min
15
min
30
min
1
hour
4
hours
1
day
1
week
Earn on cryptocurrency rate changes with InstaForex
Download MetaTrader 4 and open your first trade
  • Grand Choice
    Contest by
    InstaForex
    InstaForex always strives to help you
    fulfill your biggest dreams.
    JOIN CONTEST

Recommended Stories

How to Trade the GBP/USD Pair on May 22? Simple Tips and Trade Analysis for Beginners

Analysis of Wednesday's Trades 1H Chart of GBP/USD The GBP/USD pair maintained its upward trend on Wednesday, a movement that has developed over the past two weeks. Recall that

Paolo Greco 06:31 2025-05-22 UTC+2

How to Trade the EUR/USD Pair on May 22? Simple Tips and Trade Analysis for Beginners

Analysis of Wednesday's Trades 1H Chart of EUR/USD On Wednesday, the EUR/USD currency pair continued its upward movement calmly and steadily. The price broke through the 1.1267 level, which

Paolo Greco 06:31 2025-05-22 UTC+2

Trading Recommendations and Analysis for GBP/USD on May 22: The Pound Breaks Through Key Levels

The GBP/USD currency pair also resumed its upward movement on Wednesday. The rise of the British pound, which in reality still reflects the fall of the US dollar, began overnight

Paolo Greco 03:30 2025-05-22 UTC+2

Trading Recommendations and Analysis for EUR/USD on May 22: Reasons Don't Matter and Aren't Needed

The EUR/USD currency pair resumed its upward movement on Wednesday, and it is now safe to say that the uptrend is present not only in the hourly timeframe but also

Paolo Greco 03:30 2025-05-22 UTC+2

How to Trade the GBP/USD Pair on May 21? Simple Tips and Trade Analysis for Beginners

Analysis of Tuesday's Trades 1H Chart of GBP/USD The GBP/USD pair mainly traded sideways on Tuesday, but early Wednesday morning it surged upward. On the 4-hour timeframe, it's clear that

Paolo Greco 06:17 2025-05-21 UTC+2

How to Trade the EUR/USD Pair on May 21? Simple Tips and Trade Analysis for Beginners

Analysis of Tuesday's Trades 1H Chart of EUR/USD On Tuesday, the EUR/USD currency pair traded sideways, but it resumed its upward movement early Wednesday morning. This indicates that the ongoing

Paolo Greco 06:17 2025-05-21 UTC+2

Trading Recommendations and Analysis for GBP/USD on May 21: The British Pound Remains in a Flat Range

The GBP/USD currency pair continued to trade within the boundaries of a sideways channel on Tuesday, which has existed for over a month and is clearly visible. While on Monday

Paolo Greco 03:48 2025-05-21 UTC+2

Trading Recommendations and Analysis for EUR/USD on May 21: The Euro Continues to Climb

The EUR/USD currency pair mostly traded sideways throughout Tuesday. Unlike Monday, traders had no formal reason to sell the dollar, something they've been doing frequently lately. As a reminder, Monday's

Paolo Greco 03:48 2025-05-21 UTC+2

How to Trade the GBP/USD Pair on May 20? Simple Tips and Trade Analysis for Beginners

Analysis of Monday's Trades 1H Chart of GBP/USD Throughout Monday, the GBP/USD pair continued its upward movement, and at first glance, it might seem that a new uptrend is forming

Paolo Greco 05:40 2025-05-20 UTC+2

How to Trade the EUR/USD Pair on May 20? Simple Tips and Trade Analysis for Beginners

Analysis of Monday's Trades 1H Chart of EUR/USD The EUR/USD currency pair surged upward on Monday with renewed strength. But what justified this move, given that Monday's macroeconomic and fundamental

Paolo Greco 05:40 2025-05-20 UTC+2
Can't speak right now?
Ask your question in the chat.
Widget callback
 

Dear visitor,

Your IP address shows that you are currently located in the USA. If you are a resident of the United States, you are prohibited from using the services of InstaFintech Group including online trading, online transfers, deposit/withdrawal of funds, etc.

If you think you are seeing this message by mistake and your location is not the US, kindly proceed to the website. Otherwise, you must leave the website in order to comply with government restrictions.

Why does your IP address show your location as the USA?

  • - you are using a VPN provided by a hosting company based in the United States;
  • - your IP does not have proper WHOIS records;
  • - an error occurred in the WHOIS geolocation database.

Please confirm whether you are a US resident or not by clicking the relevant button below. If you choose the wrong option, being a US resident, you will not be able to open an account with InstaForex anyway.

We are sorry for any inconvenience caused by this message.