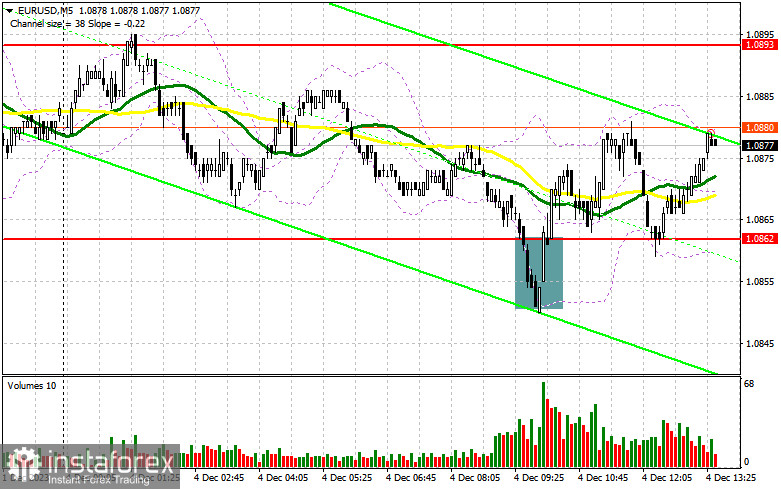
In my morning forecast, I highlighted the level of 1.0862 and recommended making entry decisions based on it. Let's look at the 5-minute chart and analyze what happened there. The decline and the formation of a false breakout around 1.0862 led to a good buy signal, anticipating the continuation of the bullish momentum observed at the end of last week. As a result, the pair rose by about 20 points, and that's where it currently stands. Considering that the level of 1.0862 performed well in the first half of the day, the technical picture remained unchanged for the American session.
To open long positions on EUR/USD:
During the American session, there are no significant statistics, and data on US factory orders are unlikely to change the balance of power significantly. However, given that sellers still prevail in the market, I will act only on declines following the formation of a false breakout around 1.0862, similar to what I analyzed earlier. Only this will provide an entry point for long positions, anticipating the rise of EUR/USD and testing the new resistance at 1.0893, formed at the end of last Friday. Its breakout and updating from top to bottom will depend on statements from Christine Lagarde, the President of the ECB, signaling a buying opportunity and a chance for an update to 1.0920. The ultimate target will be the area of 1.0947, where I will take profits. In the scenario of further decline in EUR/USD and the absence of activity at 1.0862 in the second half of the day (as this level has already been tested once today), trading will stay within the framework of a new descending channel, creating even more problems for buyers. In this case, I will enter the market only after forming a false breakout around 1.0832 - last week's minimum. I will open long positions immediately on the rebound from 1.0804, with the goal of an upward correction within the day by 30-35 points.
To open short positions on EUR/USD:
Sellers remain in the market, but there are no fundamental reasons for increasing short positions yet, which prevented a decline to 1.0862 in the first half of the day. For this reason, it is best to wait for growth and the formation of a false breakout at 1.0893, which will provide an excellent selling signal for further building a bearish market. The target will be the same support at 1.0862. Only after breaking through and consolidating below this range, as well as a bottom-up retest, do I expect to get another sell signal with an exit to 1.0832. The ultimate target will be a minimum of 1.0804, where I will take profits. In the case of an upward movement of EUR/USD during the American session and the absence of bears at 1.0893, where the moving averages pass, buyers will try to stop the correction and restore balance to the market. This will open the way for buyers to a maximum of 1.0920. Selling there will be possible only after an unsuccessful consolidation. I will open short positions immediately on the rebound from 1.0947, with the goal of a downward correction by 30-35 points.
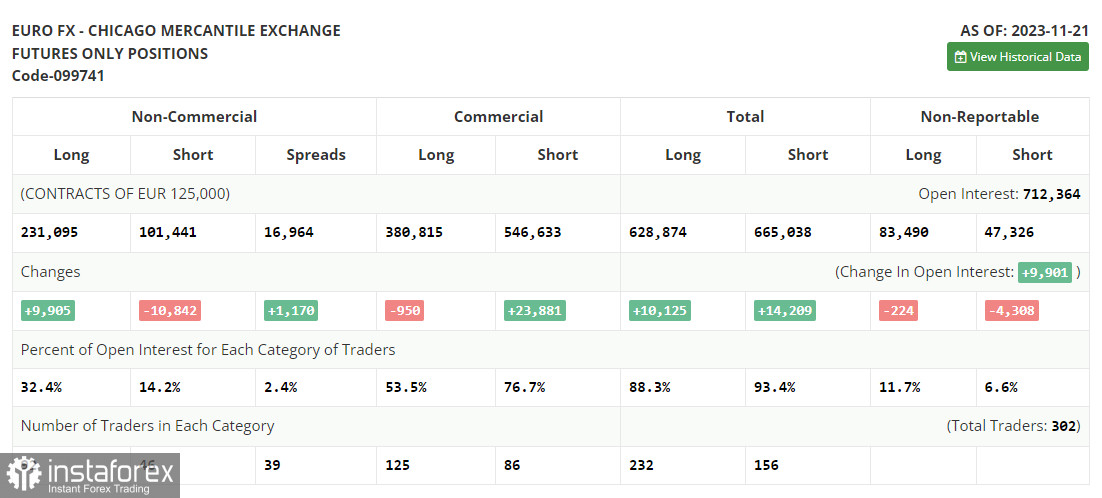
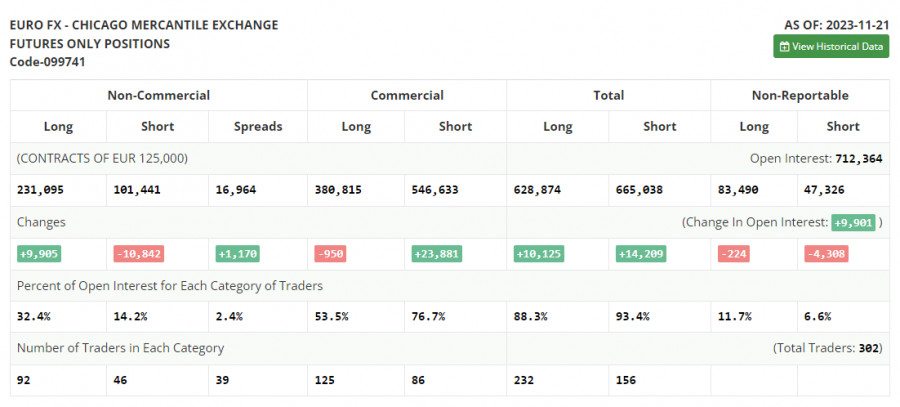
In the COT report (Commitment of Traders) for November 21, there was an increase in long positions and another significant reduction in shorts. Statements by representatives of the European Central Bank and their commitment to high-interest rates led to new euro purchases last week, as did data on PMI index activity, which showed a slight recovery in some eurozone countries, leaving a chance to avoid a recession in the 4th quarter of this year. The publication of the minutes of the November meeting of the US Federal Reserve slightly cooled risk asset buyers but did not significantly affect the development of the bullish trend. In the near future, many important fundamental statistics related to inflation and consumer confidence will be released, affecting the market direction. The COT report states that long non-commercial positions increased by 9,905 to 231,095, while short non-commercial positions decreased by 10,842 to 101,441. As a result, the spread between long and short positions increased by 1,170. The closing price rose and amounted to 1.0927 against 1.0902.
Indicator signals:
Moving averages
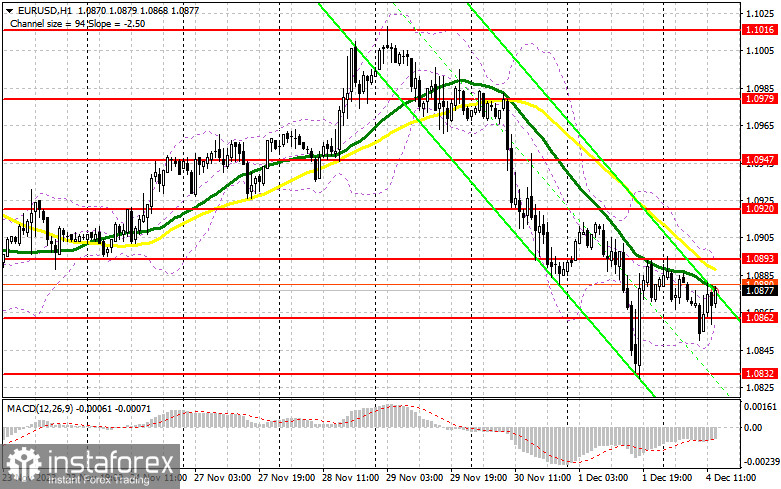
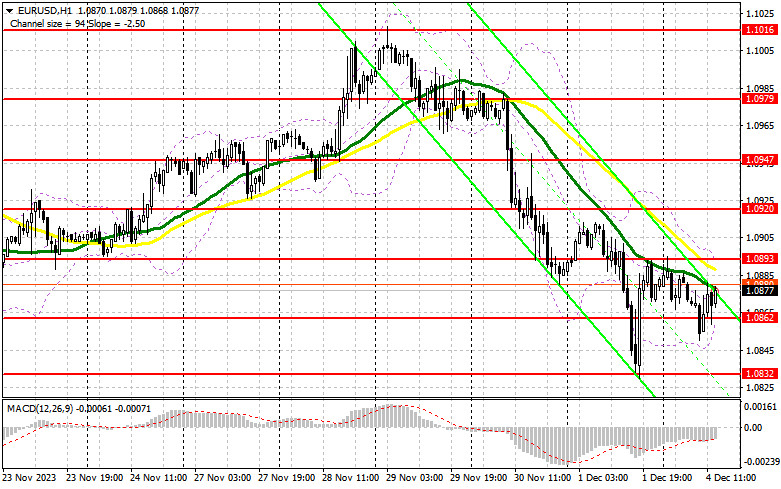
Trading is conducted below the 30 and 50-day moving averages, indicating the advantage of sellers.
Note: The author considers the period and prices of moving averages on the hourly chart H1, which differs from the general definition of classical daily moving averages on the daily chart D1.
Bollinger Bands
In case of a decline, the lower boundary of the indicator at 1.0862 will act as support.
Description of Indicators:
- Moving average (determines the current trend by smoothing volatility and noise). Period 50. Marked on the chart in yellow.
- Moving average (determines the current trend by smoothing volatility and noise). Period 30. Marked on the chart in green.
- MACD indicator (Moving Average Convergence/Divergence — convergence/divergence of moving averages). Fast EMA period 12. Slow EMA period 26. SMA period 9.
- Bollinger Bands. Period 20.
- Non-commercial traders - speculators, such as individual traders, hedge funds, and large institutions, use the futures market for speculative purposes and meet certain requirements.
- Long non-commercial positions represent the total long open position of non-commercial traders.
- Short non-commercial positions represent the total short open positions of non-commercial traders.
- The total non-commercial net position is the difference between non-commercial traders' short and long positions.