empty
27.03.2025 05:45 AM
#NDX – Technical Analysis Overview

This image is no longer relevant

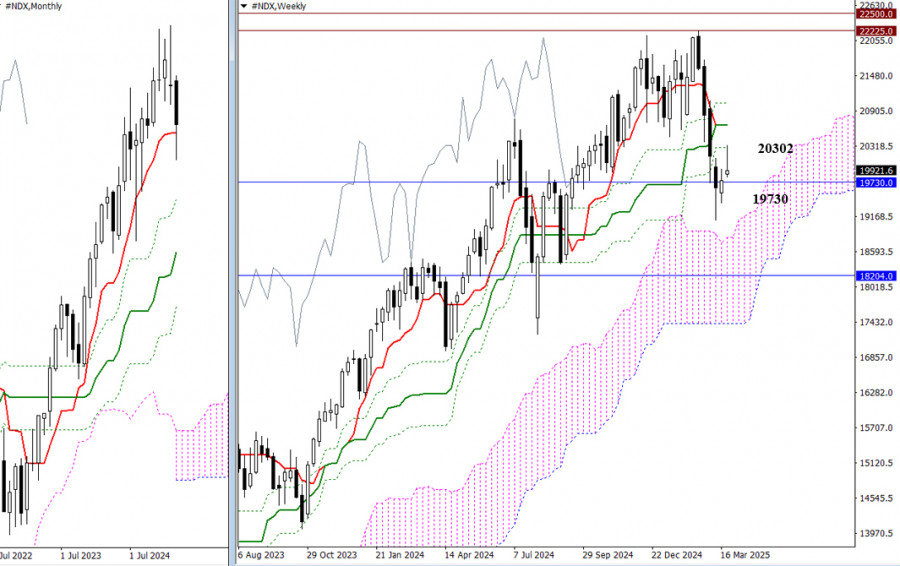
A stall at the monthly short-term trend level (19730) prompted an effort by bulls to reclaim their positions. As a result, a bullish gap formed at the start of the new trading week, with a test of the weekly resistance level at 20302. If this level is breached, the market will face two additional weekly resistance zones slightly above (20669 – 21036). However, if bulls lose momentum during a retest, the opposing side could swiftly return the market to the gravitational zone around the monthly Tenkan (19730), aiming to break the recent low (19113) and intensify bearish sentiment.

This image is no longer relevant

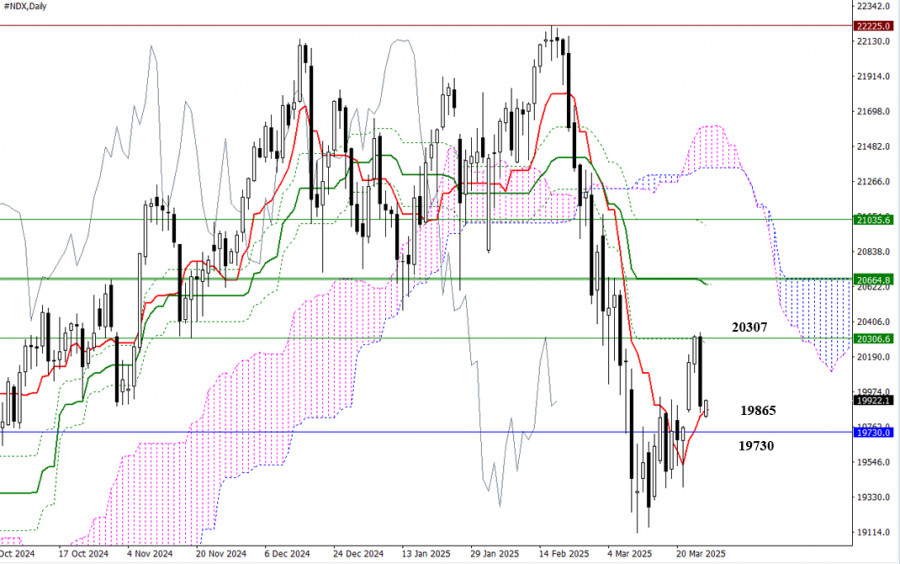
Yesterday's test of the Kijun Fibonacci levels (daily and weekly at 20302) resulted in a daily rebound. By the end of the session, the market had corrected downward to the daily short-term trend level (19865). The daily short-term trend supports (19865) and monthly supports (19730) will try to defend bullish interests. Failure to hold, breaking these supports, and moving out of the current attraction zone will shift market attention toward bearish targets—specifically, a new low at 19113 and a possible resumption of the broader downtrend.

This image is no longer relevant

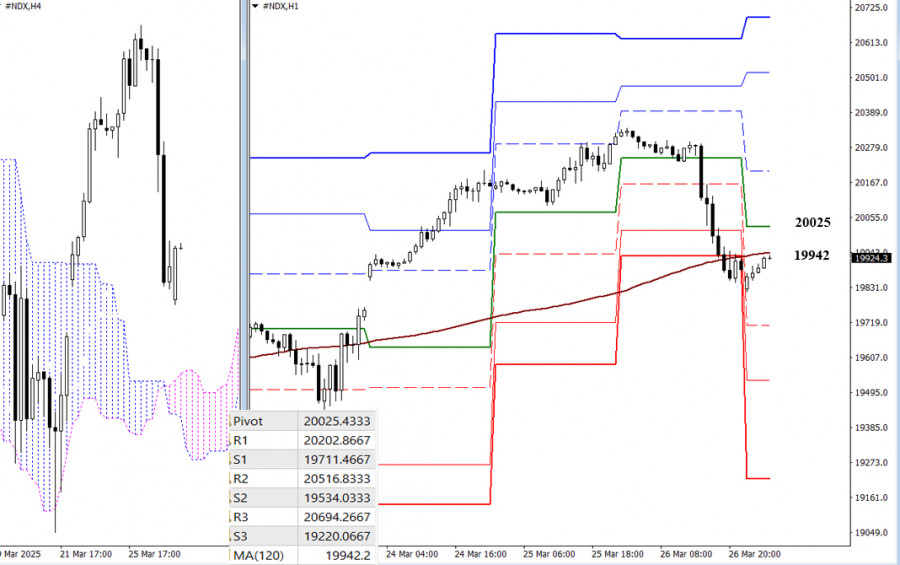
In the lower timeframes, the market now interacts with a key level determining the primary advantage: the weekly long-term trend in 19942. Whichever side holds this level will likely gain further momentum. Additional intraday bearish targets include the support levels of the classic Pivot Points (19712 – 19534 – 19220). Resistance levels at the classic Pivot Points (20025 – 20203 – 20517 – 20694) may serve as useful guides for bulls aiming to recover.

***

Technical Analysis Components:
  • Higher Timeframes: Ichimoku Kinko Hyo (9.26.52) and Fibonacci Kijun levels
  • H1: Classic Pivot Points and 120-period Moving Average (weekly long-term trend)
Evangelos Poulakis,
انسٹافاریکس کا تجزیاتی ماہر
© 2007-2025
ٹائم فریم منتخب کریں
5
منٹ
15
منٹ
30
منٹ
1
گھنٹہ
4
گھنٹے
1
دن
1
ہفتہ
انسٹافاریکس کے ساتھ کرپٹو کرنسی کی معاملاتی تبدیلیوں سے کمائیں۔
میٹا ٹریڈر 4 ڈاؤن لوڈ کریں اور اپنی پہلی ٹریڈ کھولیں۔
  • Grand Choice
    Contest by
    InstaForex
    InstaForex always strives to help you
    fulfill your biggest dreams.
    مقابلہ میں شامل ہوں

تجویز کردہ مضامین

ایکس اے یو / یو ایس ڈی : تجزیہ، پیشن گوئی، اور موجودہ مارکیٹ کی صورتحال

سونا آج انٹرا ڈے ٹون میں مندی کو برقرار رکھے ہوئے ہے۔ روزانہ چارٹ پر آسکیلیٹر ابھی منفی رفتار دکھانا شروع کر رہے ہیں، جو دھات کی قیمت میں مزید

Irina Yanina 14:25 2025-07-07 UTC+2

جی بی پی / یو ایس ڈی : سٹرلنگ سپورٹ حاصل کرنا بند کر سکتا ہے۔

جیسا کہ پہلے متعدد مواقع پر ذکر کیا گیا ہے، غیر ملکی کرنسی (فاریکس) مارکیٹ میں امریکی ڈالر کے مقابلے میں تجارت کی جانے والی بڑی کرنسیوں کی طاقت

Pati Gani 15:00 2025-07-03 UTC+2

یو ایس ڈی / جے پی وائے ۔ تجزیہ، پیشن گوئی، اور موجودہ مارکیٹ کی صورتحال

یہ کہ 4 گھنٹے کے چارٹ پر موجود منفی آسکیلیٹر اس بات کی نشاندہی کرتے ہیں کہ مزید اوپر کی حرکت کو فروخت کے موقع کے طور پر دیکھا

Irina Yanina 19:37 2025-07-02 UTC+2

جولائی 2-8 2025 کے لیے سونے (ایکس اے یو / یو ایس ڈی) کے لیے تجارتی اشارہ: 3,325 سے اوپر خریدیں (21 ایس ایم اے - 200 ایس ایم اے)

سونا ایک نئے تیزی کے سلسلے کی تیاری کر رہا ہے، اس لیے قیمت 3,325 یا 3,312 سے اوپر مستحکم ہو جاتی ہے۔ کسی بھی تکنیکی ریباؤنڈ کو خرید سگنل

Dimitrios Zappas 19:26 2025-07-02 UTC+2

جولائی 2-5 2025 کے لیے یورو / یو ایس ڈی کے لیے تجارتی سگنل: 1.1840 سے نیچے فروخت کریں (+1/8 مرے - 21 ایس ایم اے)

اگر یورو 1.1762 سے نیچے ٹوٹ جاتا ہے اور اس پرائس زون سے نیچے مستحکم ہوتا ہے تو، ایک بیئرش ایکسلریشن ممکن ہے۔ لہذا، یورو / یو ایس ڈی 1.1620

Dimitrios Zappas 19:23 2025-07-02 UTC+2

یورو ۔ یو ایس ڈی 30 جون۔ کرسٹین لیگارڈ کی تقریر سے کیا توقع کی جائے؟

جمعہ کو، یورو / یو ایس ڈی پئیر نے اپنی اوپر کی حرکت جاری رکھی۔ 1.1712 پر 127.2% ریٹریسمنٹ لیول نسبتاً کمزور ثابت ہوا۔ تاہم، اس کے اوپر ایک قریب

Samir Klishi 14:20 2025-06-30 UTC+2

جی بی پی / یو ایس ڈی کی پیشن گوئی برائے 30 جون 2025

گھنٹہ وار چارٹ پر، جمعہ کو جی بی پی / یو ایس ڈی جوڑی نے ایک طرف تجارت کی۔ تیزی کے تاجروں نے 1.3749 پر 200.0% ریٹریسمنٹ

Samir Klishi 14:08 2025-06-30 UTC+2

یو ایس ڈی / جے پی وائے تجزیہ، پیشن گوئی اور موجودہ مارکیٹ کی صورتحال

آج، ٹوکیو میں صارفین کی قیمتوں میں کمی کو ظاہر کرنے والے اعداد و شمار کے اجراء کے بعد، جاپانی ین کمزور ہونا شروع ہوا۔ اس خبر سے ان توقعات

Irina Yanina 11:16 2025-06-27 UTC+2

سونا: اس میں کیوں ایک مرتبہ دوبارہ اضافہ ہو رہا ہے

زرد دھات کو ایک بار پھر دو اہم عوامل کی وجہ سے سپورٹ مل رہی ہے۔ پہلا تہران اور تل ابیب کے درمیان مذاکرات کی ناکامی کا مسلسل خطرہ ہے۔

Pati Gani 14:56 2025-06-26 UTC+2

جون 24-25 2025 کے لیے یورو / یو ایس ڈی کے لیے تجارتی سگنل: 1.1620 سے نیچے فروخت کریں (ٹرپل ٹاپ - 8/8 مرے)

ایچ 4 چارٹ ٹرپل ٹاپ فارمیشن پیٹرن دکھاتا ہے۔ اگر یورو کی قیمت 1.1620 سے نیچے آتی ہے، تو سگنل منفی ہو گا، اور ہم 1.1533 پر ہدف کے ساتھ

Dimitrios Zappas 20:25 2025-06-24 UTC+2
ابھی فوری بات نہیں کرسکتے ؟
اپنا سوال پوچھیں بذریعہ چیٹ.
Widget callback
 

Dear visitor,

Your IP address shows that you are currently located in the USA. If you are a resident of the United States, you are prohibited from using the services of InstaFintech Group including online trading, online transfers, deposit/withdrawal of funds, etc.

If you think you are seeing this message by mistake and your location is not the US, kindly proceed to the website. Otherwise, you must leave the website in order to comply with government restrictions.

Why does your IP address show your location as the USA?

  • - you are using a VPN provided by a hosting company based in the United States;
  • - your IP does not have proper WHOIS records;
  • - an error occurred in the WHOIS geolocation database.

Please confirm whether you are a US resident or not by clicking the relevant button below. If you choose the wrong option, being a US resident, you will not be able to open an account with InstaForex anyway.

We are sorry for any inconvenience caused by this message.