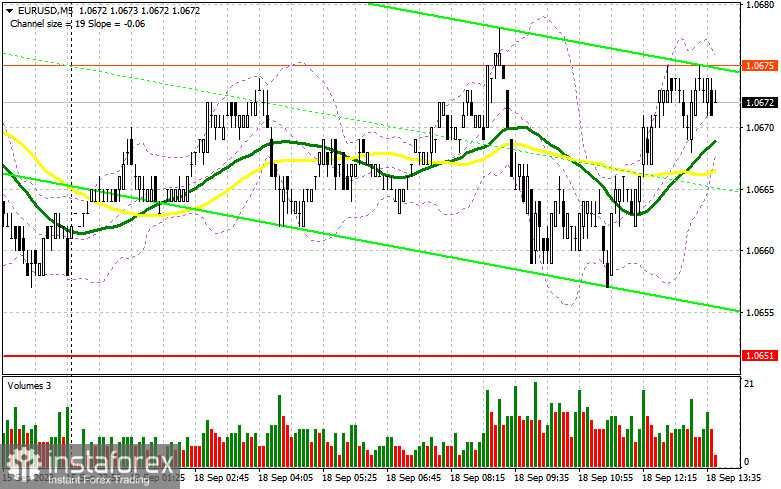
In my morning forecast, I drew attention to the level of 1.0685 and recommended making decisions regarding market entry based on it. Let's look at the 5-minute chart and analyze what happened there. The euro's rise did occur, but we have yet to reach the 1.0685 update. The technical picture remained unchanged for the second half of the day.
For opening long positions on EUR/USD, the following is required:
Considering the extremely low market volatility and the absence of important fundamental statistics from the US, the American session will likely proceed in the same scenario as the first half of the day. I will act using the European session plan only on a decline towards the support area of 1.0651, just above which the moving averages pass. The formation of a false breakout there will confirm a suitable entry point for long positions targeting a recovery towards 1.0685. A breakout and a top-down test of this range will strengthen demand for the euro, providing an opportunity for a correction at the beginning of the week and a jump to 1.0715. The ultimate goal will be the area around 1.0746, where I will take profit. In the case of a decline in EUR/USD and the absence of activity at 1.0651, which is likely to be the case, bears will strengthen their control over the market. In this case, only the formation of a false breakout around 1.0620 will signal a Euro purchase. I will open long positions from 1.0588 with the goal of an intraday upward correction of 30-35 points.
To open short positions on EUR/USD, the following is required:
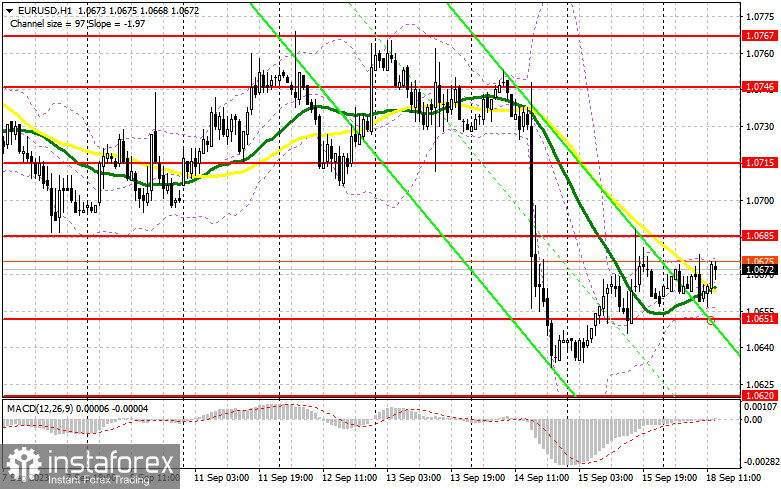
Sellers have also taken a wait-and-see position before the important Federal Reserve meeting. For this reason, I would like to get an entry point on a false breakout around 1.0685, which will trigger a sell signal with a move towards 1.0651. A breakthrough and a bottom-up test of this level will also be a suitable signal for increasing short positions, opening the way to a new monthly minimum of around 1.0620. The ultimate target will be the area around 1.0588, where I will take profit. In the event of an upward movement in EUR/USD during the American session and the absence of bears at 1.0685, which is quite possible due to low trading volume today, euro buyers will get a chance. In this scenario, I will postpone short positions until the new resistance at 1.0715. It can also be sold, but only after an unsuccessful consolidation. I will open short positions immediately on a rebound from the 1.0746 maximum with the goal of a downward correction of 30-35 points.
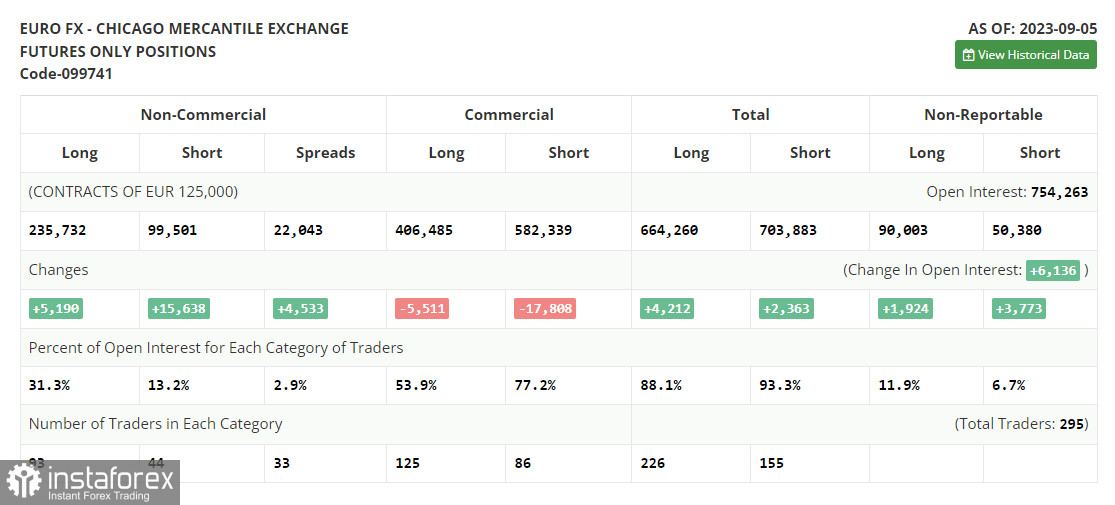
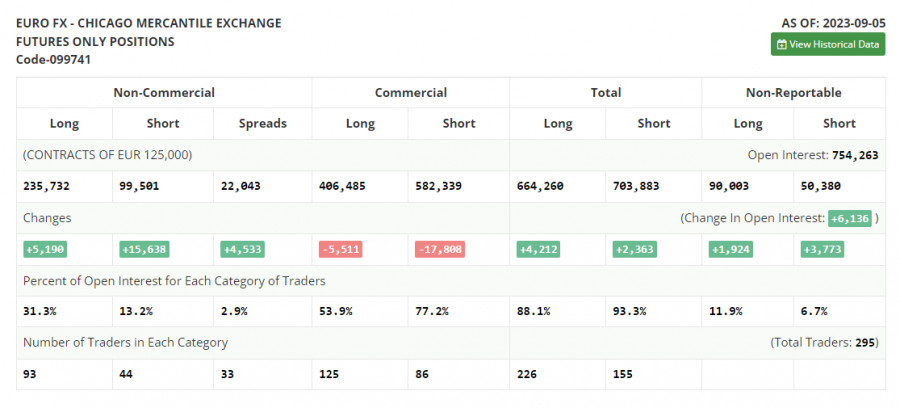
The COT report (Commitment of Traders) for September 5th showed an increase in both long and short positions. Significant negative changes in activity in the Eurozone and a downward revision of GDP for the second quarter have led to an increase in short positions in the trading instrument. Add to all of this the statements from Fed representatives that interest rates in the US may be raised again, and it becomes clear why the dollar is showing strength while the European currency is weakening. Ahead of us are very important inflation figures for the US, which will determine the future of monetary policy and will certainly affect the direction of EUR/USD. But in the context of the decline in the euro's exchange rate, long positions have increased, indicating a fairly high interest from risk asset buyers at these attractive prices. The COT report indicates that non-commercial long positions have increased by 5,190 to 235,732, while non-commercial short positions have jumped by 15,638 to 99,501. As a result, the spread between long and short positions has increased by 4,533. The closing price decreased to 1.0728 from 1.0882, indicating a bearish market.
Indicator signals:
Moving averages
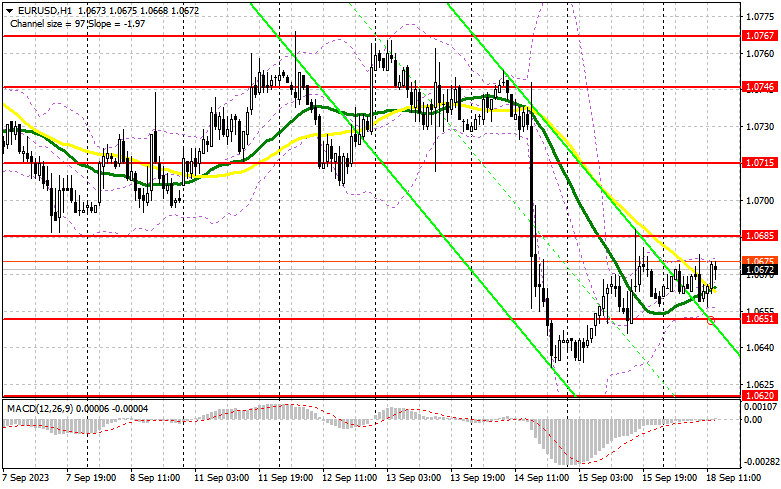
Trading occurs around the 30 and 50-day moving averages, indicating a sideways market.
Note: The author considers the period and prices of moving averages on the H1 hourly chart and differs from the general definition of classical daily moving averages on the D1 daily chart.
Bollinger Bands
In the case of an uptrend, the upper boundary of the indicator at around 1.0677 will act as resistance.
Description of Indicators
• Moving average (determines the current trend by smoothing out volatility and noise). Period 50. Marked on the chart in yellow.
• Moving average (determines the current trend by smoothing out volatility and noise). Period 30. Marked on the chart in green.
• MACD indicator (Moving Average Convergence/Divergence – convergence/divergence of moving averages). Fast EMA period 12. Slow EMA period 26. SMA period 9.
• Bollinger Bands. Period 20.
• Non-commercial traders - speculators, such as individual traders, hedge funds, and large institutions using the futures market for speculative purposes and meeting specific requirements.
• Long non-commercial positions represent the total long open positions of non-commercial traders.
• Short non-commercial positions represent the total short open positions of non-commercial traders.
• The total non-commercial net position is the difference between non-commercial traders' short and long positions.