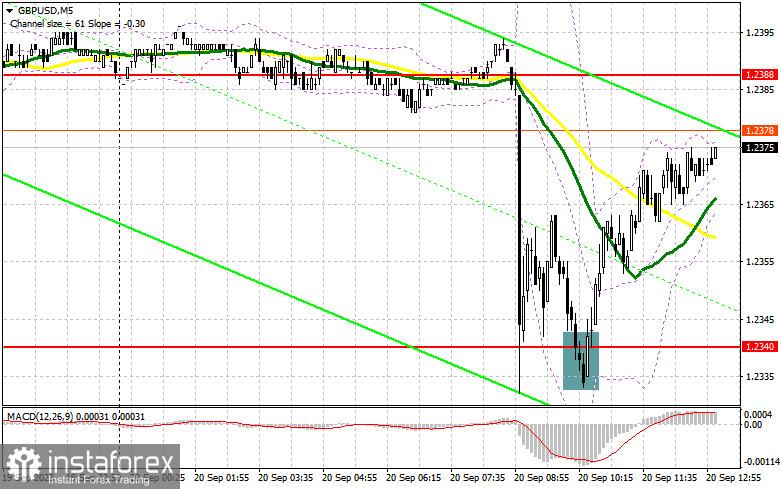
In my morning forecast, I emphasized the level of 1.2340 and recommended making trading decisions based on it. Let's look at the 5-minute chart and analyze what happened there. The drop and the formation of a false breakout at 1.2340 signaled a buying opportunity, resulting in a nearly 40-point increase in the pair. The technical picture remained unchanged for the second half of the day.
To open long positions on GBP/USD, the following is required:
Inflation data in the UK weighed on the pound. However, considering that more and more discussions are related to the Federal Reserve's dovish stance during today's meeting, buyers took advantage of this moment and quickly reversed the downward movement. This could indicate an attempt to find a foothold in the bearish market. If the Federal Reserve keeps rates unchanged in the second half of the day but revises its inflation forecasts for the next year upward and discusses a longer period of high-interest rates, which seems quite likely, the demand for the dollar will return, and the pair will resume its decline. However, if the Fed's stance is more dovish, as recent data on US price growth suggests, risk assets could perform well against the US dollar. This applies to the British pound as well.
In the event of a decline in GBP/USD, only the formation of a false breakout around the morning support level of 1.2336, similar to what I explained above, would provide another entry point for long positions. In this case, the target will be the resistance level of 1.2380, below which the moving averages are located, favoring the sellers. A breakout and consolidation above this range will strengthen the buyers' confidence, providing a signal to open long positions with an exit towards 1.2421, where I expect larger sellers to appear. The ultimate target will be around 1.2459, where I will take profits. However, reaching this area will only be possible if the Federal Reserve adopts a more dovish stance. In the scenario of a decline to 1.2336 and the absence of buyer activity in the second half of the day, as this level has already been tested several times, the pressure on the pound will only intensify, opening the way to new monthly lows. In this case, only the protection of 1.2308, as well as a false breakout there, will provide a signal to open long positions. I plan to buy GBP/USD immediately on a rebound only from the minimum of 1.2275, with a target for an upward correction of 30-35 points during the day.
To open short positions on GBP/USD, the following is required:
Only the defense of the new resistance at 1.2380 and a false breakout at it in the second half of the day will become a suitable entry point for short positions, paving the way back to the monthly minimum of 1.2336. A breakout and a retest from below this range will deal a more serious blow to the bullish positions, providing an opportunity for a decline to the support at 1.2308. The more distant target remains the area of 1.2275, where I will take profits. In the scenario of a rise in GBP/USD and the absence of activity at 1.2380, buyers will have an excellent chance for a correction, especially if the Federal Reserve's position turns out to be quite dovish. In this case, I will postpone selling until a false breakout at 1.2421. Without a downward movement there, I will only sell the pound on a rebound from 1.2459, but with the expectation of a 30-35 point downward correction during the day.
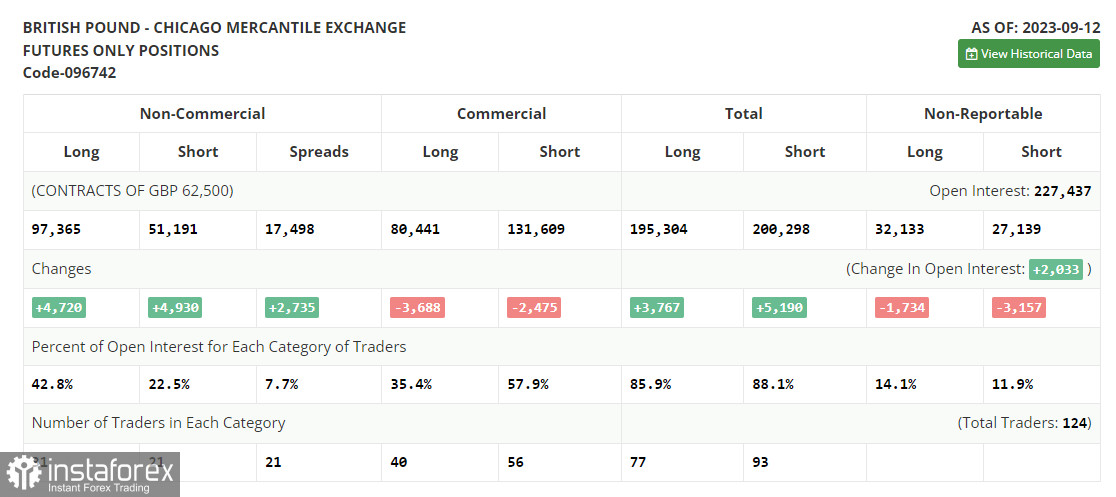
In the COT (Commitment of Traders) report for September 12th, both long and short positions increased. The released data on wage growth in the UK affects inflation negatively, and the contraction of the UK's GDP led to another sell-off of the British pound, which may intensify soon. In addition to the Bank of England meeting, where the decision on interest rates is far from clear, there is a report on the Consumer Price Index. Almost all economists expect increased inflationary pressure in the UK in August of this year. You can understand what this may lead to against a weakening economy – another major pound sell-off against the US dollar. In the latest COT report, it is stated that long non-commercial positions increased by 4,720 to the level of 97,365, while short non-commercial positions also jumped by 4,930 to 51,191. As a result, the spread between long and short positions increased by 2,735. The weekly closing price dropped and stood at 1.2486 against 1.2567.
Indicator signals:
Moving averages
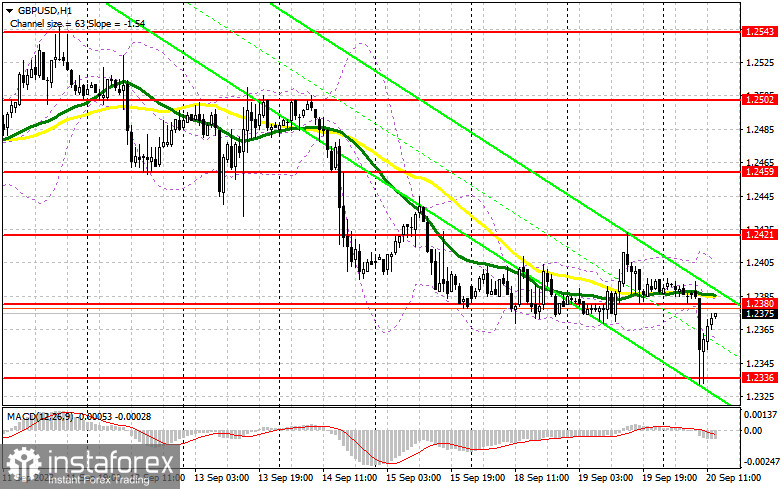
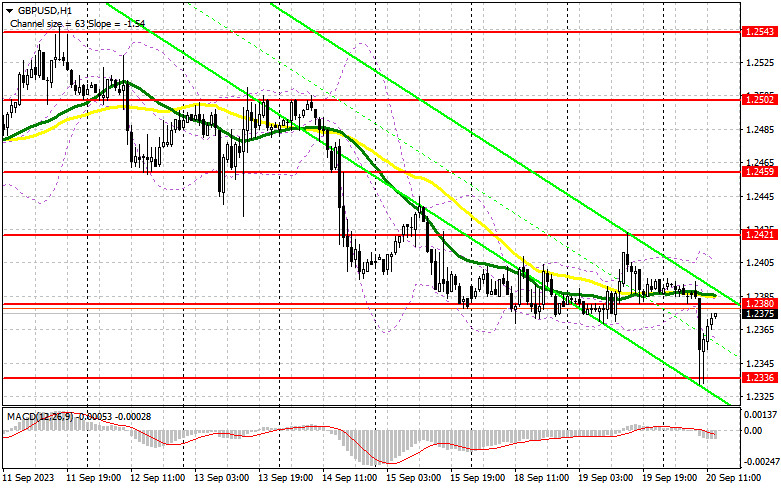
Trading is taking place below the 30 and 50-day moving averages, indicating further decline in the pair.
Note: The author considers the period and prices of moving averages on the H1 hourly chart, which differs from the general definition of classical daily moving averages on the D1 daily chart.
Bollinger Bands
In the case of a decline, the lower boundary of the indicator, around 1.2360, will serve as support.
Description of Indicators:
• Moving average (determines the current trend by smoothing out volatility and noise). Period 50. Marked on the chart in yellow.
• Moving average (determines the current trend by smoothing out volatility and noise). Period 30. Marked on the chart in green.
• MACD Indicator (Moving Average Convergence/Divergence — convergence/divergence of moving averages) Fast EMA period 12. Slow EMA period 26. SMA period 9.
• Bollinger Bands. Period 20.
• Non-commercial traders - speculators, such as individual traders, hedge funds, and large institutions, using the futures market for speculative purposes and meeting certain requirements.
• Long non-commercial positions represent the total long open positions of non-commercial traders.
• Short non-commercial positions represent the total short open positions of non-commercial traders.
• The total non-commercial net position is the difference between non-commercial traders' short and long positions.