empty
18.09.2023 01:02 PM
Weekly forecast based on simplified wave analysis for GBP/USD, AUD/USD, USD/CHF, EUR/JPY, EUR/CHF, and the US dollar index from September 18th

GBP/USD

Brief analysis:

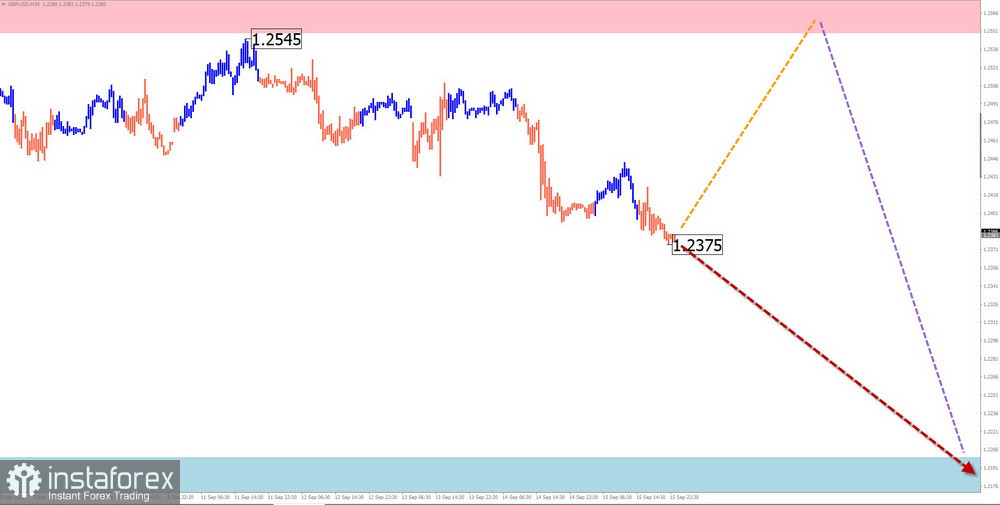
The price trend direction of the main British pound pair has been set by a descending wave algorithm since July of this year. The daily timeframe chart shows the corrective nature of this movement. The structure is missing a final segment.

Forecast for the week:

The upcoming week is expected to continue the overall downward trend of the British pound. In the first few days, a short-term price rebound upward, not exceeding the upper resistance boundary, is not excluded. Support runs along the upper level of the current wave's preliminary target zone.

This image is no longer relevant

Potential Reversal Zones

Resistance:

  • 1.2450/1.2500

Support:

  • 1.2200/1.2150

Recommendations

Buy: High risk, may result in losses.

Sell: If corresponding signals from your trading system appear, they may become the main direction for trading.

AUD/USD

Brief analysis:

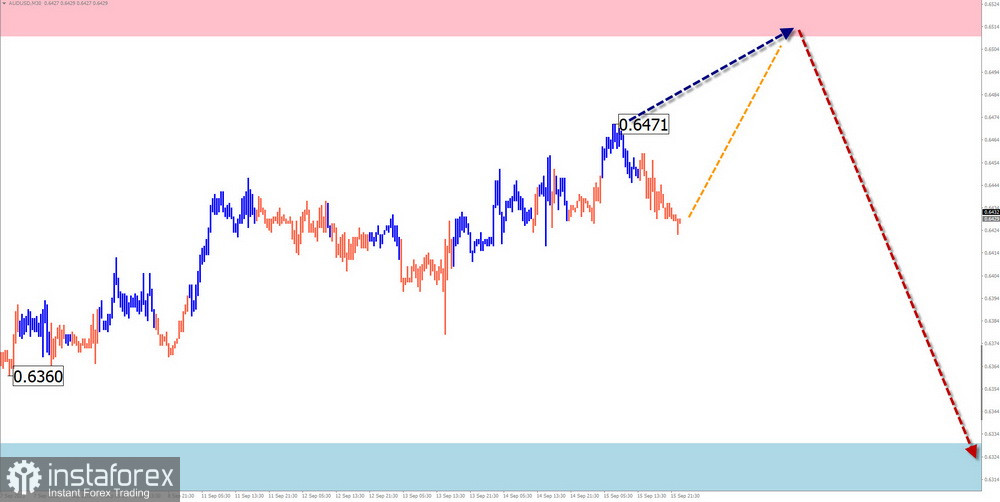
The descending wave zigzag, which started in February, brought the Aussie quotes to a powerful potential reversal zone. The wave structure was not fully formed at the time of analysis. The ongoing wave segment begins on July 14th. Recently, a corrective flat has been forming within the wave structure.

Forecast for the week:

At the beginning of the upcoming week, an upward vector is more likely, with a flat character of movement. In the second half of the week, the probability of a reversal and the resumption of the price decline increased from the resistance zone.

This image is no longer relevant

Potential Reversal Zones

Resistance:

  • 0.6510/0.6560

Support:

  • 0.6330/0.6280

Recommendations

Buy: Can be used with reduced trading volume within separate sessions. The potential is limited by resistance.

Sell: Will become relevant after confirmed reversal signals appear in the resistance zone.

USD/CHF

Brief analysis:

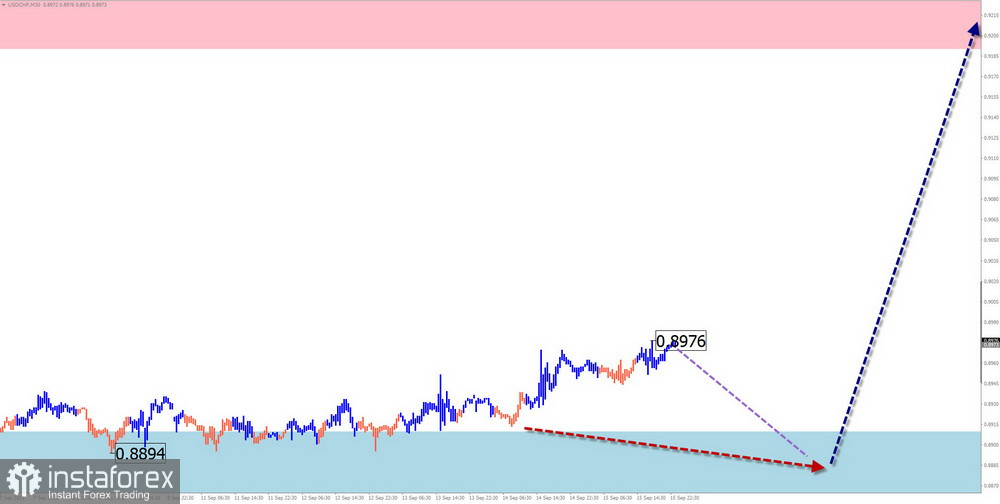
After the bearish wave that ended in mid-July, the price trend of the major Swiss franc pair is defined by a bullish wave. Its high potential suggests the transition of the entire movement to the daily timeframe. Last week, the quotes broke through intermediate resistance.

Forecast for the week:

The upcoming week is expected to be similar to the previous periods. After a likely move in the first few days along the support boundaries, we can expect a resumption of price growth. The calculated resistance demonstrates the maximum range of price increases.

This image is no longer relevant

Potential Reversal Zones

Resistance:

  • 0.9190/0.9240

Support:

  • 0.8910/0.8860

Recommendations

Selling: High risk, low potential.

Buying: After signals from your trading system appear in the support zone, they may become the primary direction for trading.

EUR/JPY

Brief analysis:

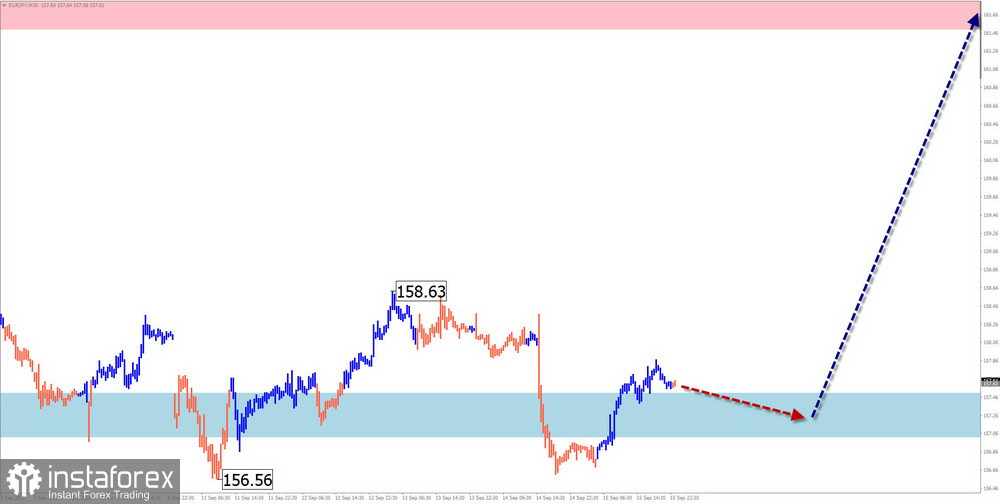
Over the past three years, the euro/yen cross rates have consistently moved north on the price chart. The current short-term unfinished wave counts from the end of July. Over the last four weeks, the price has mainly moved sideways, forming a correction. The ascending segment of the movement since September 14th has reversal potential. If confirmed, it will mark the beginning of the main wave's final part (C).

Forecast for the week:

A short-term sideways movement along the support boundaries is included in the next few days. By mid-week, the probability of increased volatility, a change in direction, and the start of active price growth increases.

This image is no longer relevant

Potential Reversal Zones

Resistance:

  • 161.50/162.00

Support:

  • 157.50/157.00

Recommendations

Selling: No conditions for trades.

Buying: This can be used for trading after signals in the support zone are confirmed by your trading system.

EUR/CHF

Brief analysis:

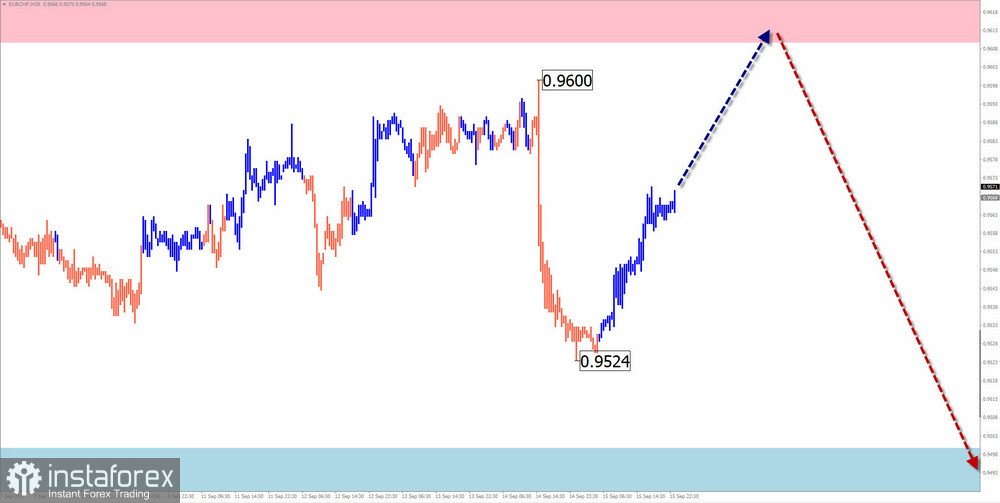
The trend direction of the euro/Swiss franc cross rates has been a descending wave since the beginning of the year. Since the end of July, a corrective flat has formed in the structure, squeezed into a narrow corridor between the ninety-seventh and ninety-fifth price figures.

Forecast for the week:

The upcoming week will continue the overall sideways mood of the cross's price movement. In the first half, an ascending vector is more likely. A reversal and the beginning of a decline towards the lower boundary can be expected closer to the end of the week.

This image is no longer relevant

Potential Reversal Zones

Resistance:

  • 0.9610/0.9660

Support:

  • 0.9500/0.9450

Recommendations

Buying: Possible with a reduced lot size for intraday trading.

Selling: This may be used for trading from the resistance zone after corresponding signals appear on your trading system.

US Dollar Index

Brief analysis:

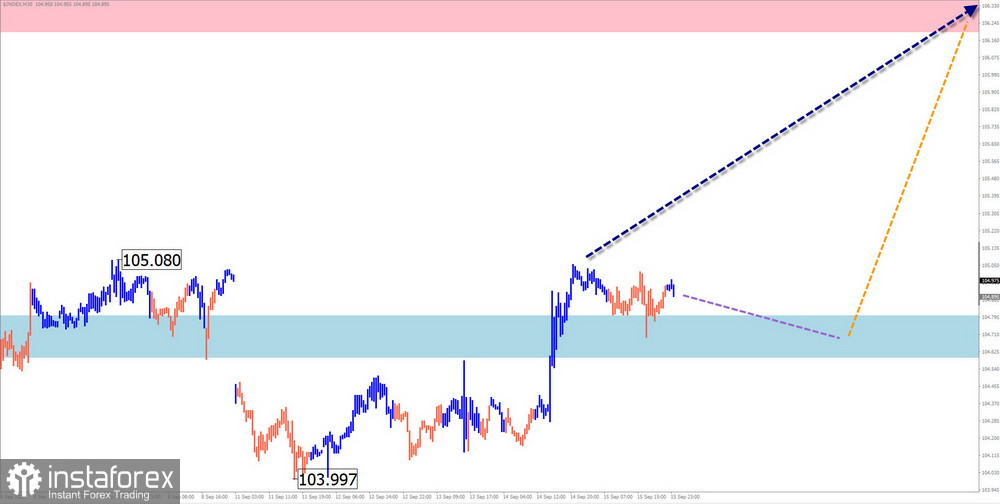
The prolonged period of weakening the US dollar's positions since a strengthening trend has replaced mid-July. It's worth noting that this wave serves as a correction to the previous trend segment on the daily timeframe chart. After breaking through the next resistance, the dollar's quotes consolidate above it.

Forecast for the week:

In the first half of the upcoming week, a sideways movement along the support boundaries can be expected. Activity and a resumption of growth are more likely towards the end of the week. Any economic data news can serve as a trigger.

This image is no longer relevant

Potential Reversal Zones

Resistance:

  • 106.20/106.70

Support:

  • 104.80/104.30

Recommendations:

Selling the US dollar in major pairs needs more potential. It is wiser to maintain bearish positions in major currencies.

Explanation: In simplified wave analysis (SWA), all waves consist of 3 parts (A-B-C). Only the last unfinished wave is analyzed in each timeframe. Dotted lines indicate expected movements.

Attention: The wave algorithm does not consider the duration of instrument movements over time!

Pilih carta masa
5
min
15
min
30
min
1
jam
4
jam
1
hari
1
minggu
Jana pendapatan melalui perubahan kadar mata wang kripto dengan InstaForex.
Muat turun MetaTrader 4 dan buka dagangan pertama anda.
  • Grand Choice
    Contest by
    InstaForex
    InstaForex always strives to help you
    fulfill your biggest dreams.
    SERTAI PERADUAN

Artikel yang dicadangkan

Analisis GBP/USD pada 22 Mei 2025

Bagi pasangan GBP/USD, struktur gelombang terus menunjukkan perkembangan arah aliran impulsif bullish. Corak gelombang ini hampir serupa dengan EUR/USD. Sehingga 28 Februari, kita telah menyaksikan pembentukan struktur pembetulan yang jelas

Chin Zhao 18:12 2025-05-22 UTC+2

Analisis EUR/USD pada 21 Mei 2025

Pola gelombang pada carta 4 jam untuk EUR/USD telah berubah menjadi struktur kenaikan harga dan kekal sedemikian. Saya percaya tidak ada yang meragui bahawa transformasi ini berlaku semata-mata disebabkan oleh

Chin Zhao 18:56 2025-05-21 UTC+2

Analisis GBP/USD pada 21 Mei 2025

Struktur gelombang, yang sebahagian besarnya didorong oleh Donald Trump, hampir sama dengan konfigurasi pasangan EUR/USD. Sehingga 28 Februari, kita telah menyaksikan pembentukan satu struktur pembetulan yang meyakinkan dan tidak menimbulkan

Chin Zhao 18:51 2025-05-21 UTC+2

Analisis GBP/USD pada 20 Mei 2025

Corak Gelombang GBP/USD terus menunjukkan pembentukan struktur gelombang impulsif menaik, hasil daripada pengaruh Donald Trump. Gambar rajah gelombang ini hampir sama dengan pasangan EUR/USD. Sehingga 28 Februari, kita telah menyaksikan

Chin Zhao 19:47 2025-05-20 UTC+2

Analisis EUR/USD pada 20 Mei 2025

Struktur gelombang pada carta EUR/USD 4-jam telah berubah menjadi struktur menaik dan terus mengekalkan bentuk tersebut. Saya percaya tidak ada keraguan bahawa perubahan ini berlaku semata-mata disebabkan oleh dasar perdagangan

Chin Zhao 19:40 2025-05-20 UTC+2

Analisis EUR/USD pada 19 Mei 2025

Corak gelombang pada carta 4 jam telah berubah menjadi struktur menaik dan kekal dalam bentuk tersebut. Saya percaya tiada keraguan bahawa transformasi ini berlaku semata-mata disebabkan dasar perdagangan baharu

Chin Zhao 18:26 2025-05-19 UTC+2

Ramalan Mingguan Menggunakan Analisis Gelombang Ringkas untuk GBP/USD, AUD/USD, USD/CHF, EUR/JPY, EUR/GBP, dan Indeks Dolar AS pada 19 Mei

GBP/USD Analisis: Sejak 8 April, GBP/USD telah bergerak menaik pada carta harga. Dari sempadan bawah zon pembalikan yang berpotensi, satu pembalikan semula telah terbentuk sejak dua bulan yang lalu. Pergerakan

Isabel Clark 11:43 2025-05-19 UTC+2

Ramalan Mingguan Menggunakan Analisis Gelombang Ringkas untuk EUR/USD, USD/JPY, GBP/JPY, USD/CAD, NZD/USD dan Emas pada 19 Mei

EUR/USD Analisis: Sejak Februari, carta EUR/USD telah membentuk gelombang menaik. Sepanjang satu setengah bulan yang lepas, segmen pembetulan (B) sedang berkembang dalam gelombang ini, yang masih belum lengkap. Seminggu yang

Isabel Clark 11:40 2025-05-19 UTC+2

Analisis GBP/USD pada 16 Mei 2025

Struktur gelombang untuk instrumen GBP/USD terus menunjukkan pembentukan turutan gelombang impulsif yang menaik. "Terima kasih" kepada Donald Trump, corak gelombang ini hampir menyerupai EUR/USD. Sehingga 28 Februari, kita menyaksikan perkembangan

Chin Zhao 18:43 2025-05-16 UTC+2

Analisis Pasangan EUR/USD pada 16 Mei 2025

Struktur gelombang dalam carta 4 jam bagi pasangan EUR/USD telah berubah kepada bentuk menaik dan terus mengekalkan formasi ini. Saya percaya hampir tiada keraguan bahawa perubahan ini berlaku semata-mata akibat

Chin Zhao 18:40 2025-05-16 UTC+2
Tidak boleh bertanya sekarang?
Tanya soalan anda di Ruangan bersembang.
Panggilan semula Widget
 

Dear visitor,

Your IP address shows that you are currently located in the USA. If you are a resident of the United States, you are prohibited from using the services of InstaFintech Group including online trading, online transfers, deposit/withdrawal of funds, etc.

If you think you are seeing this message by mistake and your location is not the US, kindly proceed to the website. Otherwise, you must leave the website in order to comply with government restrictions.

Why does your IP address show your location as the USA?

  • - you are using a VPN provided by a hosting company based in the United States;
  • - your IP does not have proper WHOIS records;
  • - an error occurred in the WHOIS geolocation database.

Please confirm whether you are a US resident or not by clicking the relevant button below. If you choose the wrong option, being a US resident, you will not be able to open an account with InstaForex anyway.

We are sorry for any inconvenience caused by this message.