empty
26.04.2023 12:26 AM
Technical analysis of GBP/USD for April 25, 2023

This image is no longer relevant

Overview:

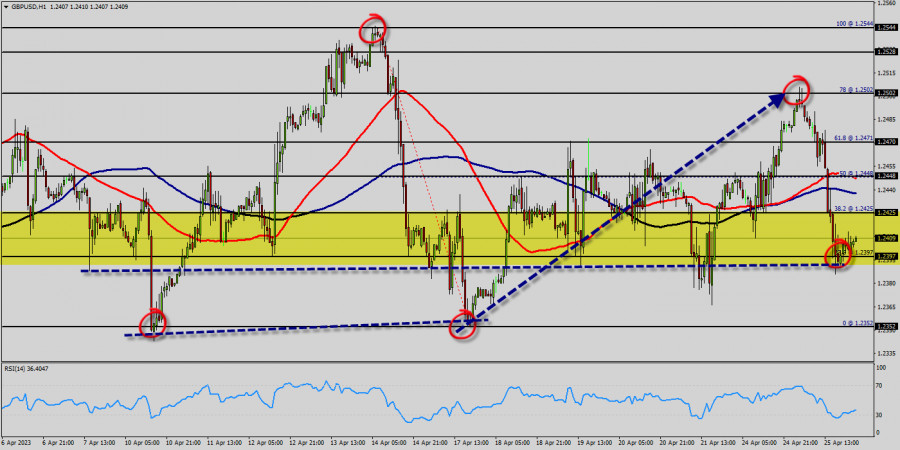
The bullish trend is currently very strong on The GBP/USD pair. As long as the price remains above the support levels of 1.2397, you could try to benefit from the growth. The first bullish objective is located at the price of 1.2425. The bullish momentum would be boosted by a break in this resistance (1.2425).

The hourly chart is currently still bullish. At the same time, some stabilization tendencies are visible between 1.2397 and 1.2035. Together with the relatively large distance to the fast-rising 100-day moving average (1.2035), there are some arguments for a relief rally in coming months on the table.

The GBP/USD pair is at highest against the dollar around the spot of 1.2035 since last week. The GBP/USD pair is inside in upward channel. For some weeks the GBP/USD pair decreased within an up channel, for that the GBP/USD pair its new highest 1.2067. Consequently, the first support is set at the level of 1.2035. Hence, the market is likely to show signs of a bullish trend around the area of 1.2000 and 1.2035.

RSI is seeing major support above 33% and a bullish divergence vs price also signals that a reversal is impending. According to the previous events the price is expected to remain between 1.2425 and 1.2397 levels. Buyers would then use the next resistance located at 1.2067 as an objective. Crossing it would then enable buyers to target 1.2502 (the double top - last bullish week).

Be careful, given the powerful bullish rally underway, excesses could lead to a possible correction in the short term. If this is the case, remember that trading against the trend may be riskier. It would seem more appropriate to wait for a signal indicating reversal of the trend. The GBP/USD pair has plunged up for a fresh two weeks high.

Prices pushed above a key retracement from a Fibonacci setup that spans from the lowest price of 1.2397 (23.6% of Fibonacci on the hourly chart), for that buyer pulled the bid back-above that level by the end of the week.

This week, the GBP/USD pair traded up and closed the day in the red area near the price of 1.2397. Today it rose a little, rising above 1.2397. If the pair succeeds in passing through the level of 1.2425, the market will indicate the bullish opportunity above the level of 1.2425 in order to reach the second target at 1.2501.

In the very short term, the general bullish sentiment is confirmed by technical indicators. Therefore, a small upwards rebound in the very short term could occur in case of excessive bearish movements. The trend is still bullish as long as the price of 1.2397 is not broken. Thereupon, it would be wise to re-buy above the price of at 1.2397 with the objective of 1.2352. We should see the pair climbing towards the next target of 1.2300. The pair will move upwards continuing the development of the bullish trend to the level 1.2501 or 1.2544 in coming days.

เลือกช่วงเวลา
5
นาที
15
นาที
30
นาที
1
ชั่วโมง
4
ชั่วโมง
1
วัน
1
สัปดาห์
รับผลกำไรจากการเปลี่ยนแปลงอัตราสกุลเงินดิจิทัลกับ InstaForex.
ดาวน์โหลด MetaTrader 4 และเปิดการซื้อขายครั้งแรกของคุณ.
การเผชิญหน้าระหว่างอิสราเอล-อิหร่าน การประชุมของเฟด ต่อไปจะเกิดอะไรขึ้น? (คาดว่าค่าเงิน USD/CAD จะลดลงต่อและมีการปรับฐานในราคาทองคำก่อนที่จะขยับสูงขึ้นอีกครั้ง) อิสราเอลและอิหร่านกำลังแลกเปลี่ยนการยิงขีปนาวุธกัน แต่ดูเหมือนว่าตลาดทุนกำลังเล่นเกมของตัวเอง โดยสันนิษฐานว่าความขัดแย้งนี้จะไม่เลยขอบเขตนิวเคลียร์ ขณะเดียวกันนักลงทุนกำลังเปลี่ยนความสนใจไปยังเหตุการณ์สำคัญในสัปดาห์นี้ ไฮไลต์หลักคือรายงานอัตราเงินเฟ้อผู้บริโภคจากสหราชอาณาจักรและยูโรโซน ในสหภาพยุโรปคาดการณ์ว่าอัตราเงินเฟ้อจะคงที่ที่ 1.9% ในขณะที่ในสหราชอาณาจักรคาดว่าจะลดลงจาก 3.5% เหลือ 3.3% เมื่อเทียบกับปีที่ผ่านมา สัปดาห์นี้ยังมีการประชุมธนาคารกลางในสวิตเซอร์แลนด์ สหราชอาณาจักร และแน่นอนว่าธนาคารกลางสหรัฐฯ
  • Grand Choice
    Contest by
    InstaForex
    InstaForex always strives to help you
    fulfill your biggest dreams.
    เข้าร่วมการแข่งขัน


บทความแนะนำ

การคาดการณ์ฟอเร็กซ์ วันที่ 16/06/2025: EUR/USD, GBP/USD, USD/JPY, น้ำมัน, ทองคำ และ Bitcoin

ลิงก์ที่มีประโยชน์: บทความอื่นๆ ของฉันสามารถอ่านได้ในส่วนนี้ หลักสูตร InstaForex สำหรับผู้เริ่มต้น การวิเคราะห์ยอดนิยม เปิดบัญชีซื้อขาย สำคัญ: ผู้เริ่มต้นในการเทรด Forex ควรระมัดระวังอย่างมากในการตัดสินใจเข้าสู่ตลาด ก่อนการประกาศรายงานที่สำคัญ ควรหลีกเลี่ยงการเข้าเทรดในตลาดเพื่อป้องกันตัวเองจากความผันผวนที่เพิ่มขึ้น ซึ่งจะทำให้เกิดการแกว่งตัวของราคาที่รุนแรง

Sebastian Seliga 10:30 2025-06-16 UTC+2

GBP/USD – วันที่ 16 มิถุนายน: ฝ่ายซื้อยังคงรักษาระดับ 1.3527

บนกราฟรายชั่วโมง คู่เงิน GBP/USD เมื่อวันศุกร์ได้ดีดตัวสองครั้งจากระดับ 127.2% ของ Fibonacci retracement ที่ระดับ 1.3527 และปรับตัวขึ้นไปสู่โซนแนวต้านที่ระดับ 1.3611–1.3633 อย่างไรก็ตาม ก่อนหน้านั้น มันได้ดีดตัวจากโซนแนวต้านนี้และลดลงกลับไปที่ระดับ

Samir Klishi 10:27 2025-06-16 UTC+2

การวิเคราะห์ทางเทคนิคของการเคลื่อนไหวของราคาประจำวันของคู่สกุลเงินแปลกใหม่ USD/IDR, วันจันทร์ที่ 16 มิถุนายน 2025

เมื่อรูปแบบ Bullish 123 ปรากฏขึ้นในท่ามกลางสภาวะการอ่อนตัวของคู่สกุลเงินแปลกใหม่นี้ ซึ่งได้รับการยืนยันโดยการเคลื่อนไหวของราคาคู่เงิน USD/IDR ที่เคลื่อนที่ภายในช่อง Equisidant ที่มีความลาดชันลดลง แต่เมื่อรูปแบบนี้ก่อตัวและช่องทางสำเร็จในการถูกเจาะทะลุ ราคาคู่เงิน USD/IDR ที่ยังคงอยู่เหนือระดับ WMA (21)

Arief Makmur 07:16 2025-06-16 UTC+2

การวิเคราะห์ทางเทคนิคของการเคลื่อนไหวราคาในระหว่างวันที่ของเครื่องมือสินค้าโภคภัณฑ์น้ำมันดิบ วันจันทร์ที่ 16 มิถุนายน 2025

ในกราฟ 4 ชั่วโมงของเครื่องมือสินค้าโภคภัณฑ์น้ำมันดิบ มีการปรากฏของ Divergence ระหว่างการเคลื่อนไหวของราคา #CL กับตัวบ่งชี้ Stochastic Oscillator ซึ่งบ่งชี้ว่าในอนาคตอันใกล้อาจมีการแก้ไขที่อ่อนลง โดยระดับ 70.86 จะถูกทดสอบในอนาคตอันใกล้นี้ หากระดับนี้ถูกทำลายและปิดต่ำกว่านั้นได้สำเร็จ

Arief Makmur 07:16 2025-06-16 UTC+2

สัญญาณการซื้อขายสำหรับ EUR/USD ระหว่างวันที่ 13-19 มิถุนายน 2025: ซื้อเมื่อราคาสูงกว่า 1.1500 (21 SMA - 7/8 Murray)

ในช่วงต้นของเซสชันอเมริกัน ยูโรกำลังซื้อขายอยู่ที่ประมาณ 1.1499 ลดลงหลังจากขึ้นไปแตะระดับสูงสุดที่เห็นครั้งสุดท้ายในปี 2021 ที่ประมาณ 1.1630 ควรพิจารณาซื้อคู่เงิน EUR/USD ที่ระดับ 1.1491 เนื่องจากระดับนี้ตรงกับค่า Murray 7/8 และค่า

Dimitrios Zappas 14:14 2025-06-13 UTC+2

สัญญาณการซื้อขายทองคำ สำหรับวันที่ 13-19 มิถุนายน 2025: ขายต่ำกว่า 3,343 (21 SMA - 8/8 Murray)

ทองคำกำลังซื้อขายอยู่ที่ประมาณ 3,420 ในช่วงการซื้อขายของอเมริกา หลังจากที่ได้แตะและผ่านระดับสูงสุดที่เคยเห็นเมื่อเดือนพฤษภาคมราว 3,443 มาแล้ว เมื่อวันที่ 6 พฤษภาคม มีช่องว่างอยู่ที่ประมาณ 3,424 ช่องว่างนี้ได้รับการเติมเต็มในระหว่างช่วงการซื้อขายของยุโรป ซึ่งบ่งชี้ว่าเงินยูโรอาจเกิดการปรับตัวทางเทคนิคอย่างแรงในอีกไม่กี่วันข้างหน้าหากราคาปรับตัวอยู่ต่ำกว่าระดับ 8/8

Dimitrios Zappas 14:12 2025-06-13 UTC+2

การคาดการณ์สำหรับ EUR/USD ในวันที่ 13 มิถุนายน 2025

เมื่อวันพฤหัสบดี คู่สกุลเงิน EUR/USD ยังคงเคลื่อนไหวขึ้นและยืนเหนือระดับ 100.0% Fibonacci retracement ที่ 1.1574 อย่างไรก็ตาม ในช่วงกลางคืนเกิดการกลับอย่างรวดเร็วสนับสนุนเงินดอลลาร์สหรัฐ โดยมีการทะลุระดับนี้ลงมา และขณะนี้กำลังลดลงไปสู่ระดับ Fibonacci ที่

Samir Klishi 11:52 2025-06-13 UTC+2

การคาดการณ์สำหรับ GBP/USD ในวันที่ 13 มิถุนายน 2025

ในกราฟรายชั่วโมง คู่ GBP/USD ในวันพฤหัสบดีปรับตัวขึ้นจากระดับ 1.3520 พุ่งขึ้นไปยังโซนแนวต้านที่ 1.3611–1.3620 กระดอนจากสองครั้งก่อนที่จะลดลงสู่ระดับฟีโบนักชี retracement ที่ 127.2% ที่ 1.3527 การดีดกลับจากระดับนี้อีกครั้งจะสนับสนุนค่าเงินปอนด์และบ่งบอกถึงการเติบโตเพิ่มเติมไปยังระดับ 1.3611–1.3620

Samir Klishi 11:49 2025-06-13 UTC+2

EUR/USD. วันที่ 12 มิถุนายน: การถอยหลังของดอลลาร์​

สวัสดีครับ/ค่ะ เทรดเดอร์ทุกท่าน! เมื่อวันพุธที่ผ่านมา คู่เงิน EUR/USD ยังคงเคลื่อนไหวขึ้นต่อเนื่องหลังจากดีดตัวจากโซนสนับสนุนที่ 1.1374–1.1380 โดยสามารถปิดแนวเหนือระดับ Fibonacci retracement ที่ 76.4% ที่ 1.1454 ได้สำเร็จ

Samir Klishi 10:15 2025-06-12 UTC+2

GBP/USD. 12 มิถุนายน. ประชาธิปไตยยักษ์ใหญ่ของสหราชอาณาจักรคลอดภัย

สวัสดีครับผู้ค้าทุกท่าน! จากแผนภูมิทุกชั่วโมงในวันพุธ, คู่ GBP/USD ได้เปลี่ยนสภาพง่ายๆ ให้โดยการขยายด้านที่ดีของบาทสหภาพประชาชาติและรวมกันที่ระดับการถอยหลังของฟิโบนัชชี 161.8% ที่ 1.3520. สิ่งนี้เปิดทางให้เกิดการเติบโตเพิ่มเติมสู่โซนการต้านทานที่ 1.3611–1.3620. การสะท้อนกลับไปในโซนนี้จะทำให้เกิดประโยชน์ให้กับดอลลาร์สหรัฐฯและนำไปสู่การถดถอยลงอย่างเล็กน้อยสู่ 1.3520. การรวมกันที่อยู่เหนือโซน 1.3611–1.3620

Samir Klishi 10:15 2025-06-12 UTC+2
หากไม่สะดวกคุยในตอนนี้
ระบุคำถามไว้ได้ใน แชท.
Widget callback
 

Dear visitor,

Your IP address shows that you are currently located in the USA. If you are a resident of the United States, you are prohibited from using the services of InstaFintech Group including online trading, online transfers, deposit/withdrawal of funds, etc.

If you think you are seeing this message by mistake and your location is not the US, kindly proceed to the website. Otherwise, you must leave the website in order to comply with government restrictions.

Why does your IP address show your location as the USA?

  • - you are using a VPN provided by a hosting company based in the United States;
  • - your IP does not have proper WHOIS records;
  • - an error occurred in the WHOIS geolocation database.

Please confirm whether you are a US resident or not by clicking the relevant button below. If you choose the wrong option, being a US resident, you will not be able to open an account with InstaForex anyway.

We are sorry for any inconvenience caused by this message.