empty
18.06.2025 06:50 AM
How to Trade the GBP/USD Pair on June 18? Simple Tips and Trade Analysis for Beginners

Analysis of Tuesday's Trades

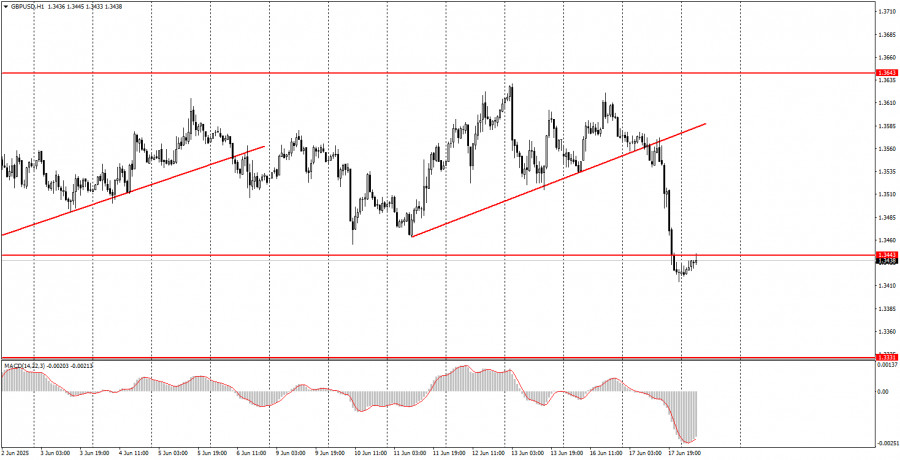
1H Chart of GBP/USD

This image is no longer relevant

On Tuesday, the GBP/USD pair also showed a relatively strong decline in the second half of the day, which could only be attributed to factors that were impossible to predict in advance. We believe the dollar strengthened due to the potential U.S. strike on Iran, which Trump has strongly hinted at over the past few days, or as an "advance reaction" to the upcoming Federal Reserve meeting. Let us recall that Washington demanded Iran sign a "nuclear deal," under which Tehran was expected to abandon any nuclear development, even for peaceful purposes. Tehran refused these terms. Trump insists that Iran must not possess nuclear weapons and is, therefore, ready to strike the country. This is yet another escalation in the Middle East conflict; in the short term, the dollar may have received some support.

As for the Fed meeting, it's extremely difficult to expect meaningful support for the dollar from the U.S. central bank right now. Hence, we also don't rule out the possibility that what we saw yesterday was a technical rally and that today, the market might actively sell the dollar at more favorable prices.

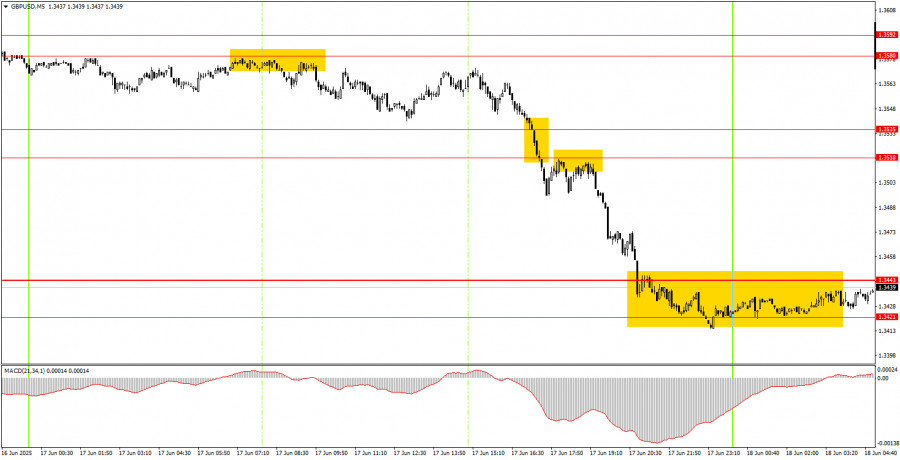
5M Chart of GBP/USD

This image is no longer relevant

On the 5-minute timeframe on Tuesday, a great sell signal was formed right at the start of the European trading session. The price bounced thrice from the 1.3580–1.3592 area, after which the pair stayed in a downward trajectory the rest of the day, forming only additional sell signals. By the end of the session, the pair reached the 1.3421–1.3443 area, where profits on the only short position could be secured. The profit amounted to at least 130–140 pips.

Trading Strategy for Wednesday:

On the hourly timeframe, the GBP/USD pair continues to respond mainly to Donald Trump's policies and still views them with great skepticism. As before, the market uses any opportunity to sell the dollar rather than buy it. This will likely continue until the market sees clear signs of the trade war ending and until Trump stops making unauthorized decisions. Occasionally, the dollar will show growth since it can't decline indefinitely every single day, but such occurrences remain rare for now.

On Wednesday, the GBP/USD pair may again show high volatility, as two potentially significant events are on the calendar today:

  1. A possible U.S. strike on Iran.
  2. The Federal Reserve meeting.

In the 5-minute timeframe, trading can be conducted around the following levels: 1.3043, 1.3102–1.3107, 1.3203–1.3211, 1.3259, 1.3329–1.3331, 1.3421–1.3443, 1.3518–1.3535, 1.3580–1.3592, 1.3643–1.3652, 1.3695, 1.3740. The UK inflation report for May will also be published on Wednesday, making it the third major event of the day. Everything points toward a "stormy" day in the markets.

Core Trading System Rules:

  1. Signal Strength: The shorter the time it takes for a signal to form (a rebound or breakout), the stronger the signal.
  2. False Signals: If two or more trades near a level result in false signals, subsequent signals from that level should be ignored.
  3. Flat Markets: In flat conditions, pairs may generate many false signals or none at all. It's better to stop trading at the first signs of a flat market.
  4. Trading Hours: Open trades between the start of the European session and the middle of the US session, then manually close all trades.
  5. MACD Signals: On the hourly timeframe, trade MACD signals only during periods of good volatility and a clear trend confirmed by trendlines or trend channels.
  6. Close Levels: If two levels are too close (5–20 pips apart), treat them as a support or resistance zone.
  7. Stop Loss: Set a Stop Loss to breakeven after the price moves 20 pips in the desired direction.

Key Chart Elements:

Support and Resistance Levels: These are target levels for opening or closing positions and can also serve as points for placing Take Profit orders.

Red Lines: Channels or trendlines indicating the current trend and the preferred direction for trading.

MACD Indicator (14,22,3): A histogram and signal line used as a supplementary source of trading signals.

Important Events and Reports: Found in the economic calendar, these can heavily influence price movements. Exercise caution or exit the market during their release to avoid sharp reversals.

Summary
Urgency
Analytic
Stanislav Polyanskiy
Start trade
Gana con los cambios en el valor de las criptomonedas con InstaForex.
Descarga MetaTrader 4 y abre tu primera operación.
  • Grand Choice
    Contest by
    InstaForex
    InstaForex always strives to help you
    fulfill your biggest dreams.
    UNIRSE AL CONCURSO

Recommended Stories

GBP/USD plan para la sesión europea del 17 de julio. Informes Commitment of Traders COT (análisis de las operaciones de ayer). La libra esterlina tuvo mucha suerte

Ayer se formaron varios puntos de entrada al mercado. Veamos el gráfico de 5 minutos y analicemos lo que ocurrió. En mi pronóstico matutino presté atención al nivel 1.3376

Miroslaw Bawulski 07:19 2025-07-17 UTC+2

EUR/USD plan para la sesión europea del 17 de julio. Informes Commitment of Traders COT (análisis de las operaciones de ayer). La presión sobre el jefe de la Fed de EE. UU. afecta negativamente al dólar

EUR/USD plan para la sesión europea del 17 de julio. Informes Commitment of Traders COT (análisis de las operaciones de ayer). La presión sobre el jefe

Miroslaw Bawulski 07:19 2025-07-17 UTC+2

Cómo operar con el par EUR/USD el 16 de julio. Consejos simples y análisis de operaciones para principiantes.

El par de divisas EUR/USD se desplomó bruscamente el martes en medio del informe sobre la inflación estadounidense. Como se suele decir, nada presagiaba el problema. Durante varios días consecutivos

Paolo Greco 07:54 2025-07-16 UTC+2

GBP/USD plan para la sesión europea del 16 de julio. Informes Commitment of Traders COT (análisis de las operaciones de ayer). Con la libra esterlina todo va mal

Ayer solo se formó un punto de entrada al mercado. Veamos el gráfico de 5 minutos y analicemos qué ocurrió. En mi pronóstico de la mañana presté atención al nivel

Miroslaw Bawulski 07:54 2025-07-16 UTC+2

EUR/USD plan para la sesión europea del 15 de julio. Informes Commitment of Traders COT (análisis de las operaciones de ayer). La inflación en EE.UU. aumentó

Ayer no llegué a ver condiciones adecuadas para entrar al mercado. Veamos el gráfico de 5 minutos y analicemos lo que ocurrió. En mi pronóstico de la mañana, presté atención

Miroslaw Bawulski 07:54 2025-07-16 UTC+2

GBP/USD plan para la sesión europea del 15 de julio. Informes Commitment of Traders COT (análisis de las operaciones de ayer). La libra esterlina continúa cayendo activamente

Ayer se formaron varios puntos de entrada al mercado. Veamos el gráfico de 5 minutos y analicemos lo que ocurrió. En mi pronóstico de la mañana presté atención al nivel

Miroslaw Bawulski 07:08 2025-07-15 UTC+2

EUR/USD plan para la sesión europea del 15 de julio. Informes Commitment of Traders COT (análisis de las operaciones de ayer). El euro mantiene sus posiciones

Ayer se formó solo un punto de entrada al mercado. Propongo echar un vistazo al gráfico de 5 minutos y analizar lo que ocurrió. En mi pronóstico de la mañana

Miroslaw Bawulski 07:08 2025-07-15 UTC+2

EUR/USD: plan para la sesión europea del 14 de julio. Informes Commitment of Traders COT (análisis de las operaciones de ayer). El euro quedó bajo presión

El pasado viernes solo se formó un punto de entrada al mercado. Veamos el gráfico de 5 minutos y analicemos lo que ocurrió allí. En mi pronóstico de la mañana

Miroslaw Bawulski 08:21 2025-07-14 UTC+2

GBP/USD: plan para la sesión europea del 11 de julio. Informes Commitment of Traders COT (análisis de las operaciones de ayer). La libra esterlina volvió al mínimo semanal

Ayer se formaron varios puntos de entrada al mercado. Veamos el gráfico de 5 minutos y analicemos lo que ocurrió. En mi pronóstico de la mañana presté atención al nivel

Miroslaw Bawulski 08:06 2025-07-11 UTC+2

EUR/USD: plan para la sesión europea del 11 de julio. Informes Commitment of Traders COT (análisis de las operaciones de ayer). El euro volvió a caer

Ayer se formaron varios puntos de entrada al mercado. Veamos el gráfico de 5 minutos y analicemos lo que ocurrió. En mi pronóstico de la mañana presté atención al nivel

Miroslaw Bawulski 08:06 2025-07-11 UTC+2
¿No puede hablar ahora mismo?
Ingrese su pregunta en el chat.
Widget callback
 

Dear visitor,

Your IP address shows that you are currently located in the USA. If you are a resident of the United States, you are prohibited from using the services of InstaFintech Group including online trading, online transfers, deposit/withdrawal of funds, etc.

If you think you are seeing this message by mistake and your location is not the US, kindly proceed to the website. Otherwise, you must leave the website in order to comply with government restrictions.

Why does your IP address show your location as the USA?

  • - you are using a VPN provided by a hosting company based in the United States;
  • - your IP does not have proper WHOIS records;
  • - an error occurred in the WHOIS geolocation database.

Please confirm whether you are a US resident or not by clicking the relevant button below. If you choose the wrong option, being a US resident, you will not be able to open an account with InstaForex anyway.

We are sorry for any inconvenience caused by this message.