empty
 
 
31.05.2023 01:20 PM
EUR/USD and GBP/USD: Technical analysis for May 31

EUR/USD

This image is no longer relevant

Higher timeframes

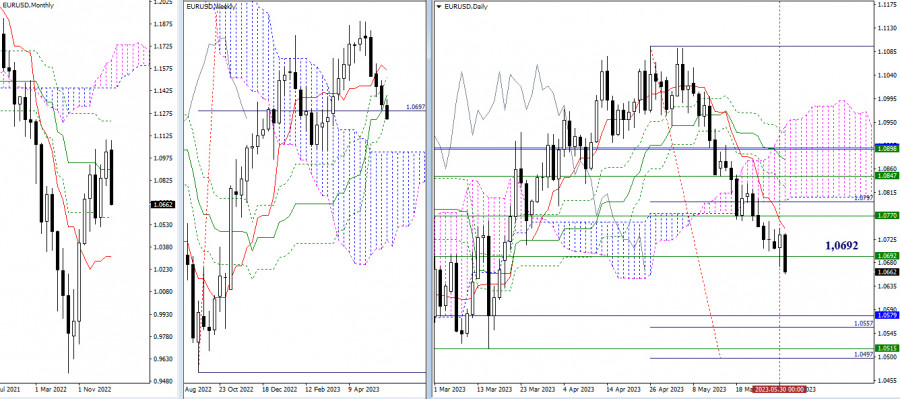
Slowing down at the weekly support of 1.0692 has turned into bearish activity. The target benchmarks for the bears in this range are the monthly support (1.0579) and the weekly support (1.0515), as well as the target for breaking the daily cloud (1.0557 - 1.0497). The nearest resistances continue to be the levels of 1.0746 - 1.0770 (daily short-term trend + weekly medium-term trend).

This image is no longer relevant

H4 - H1

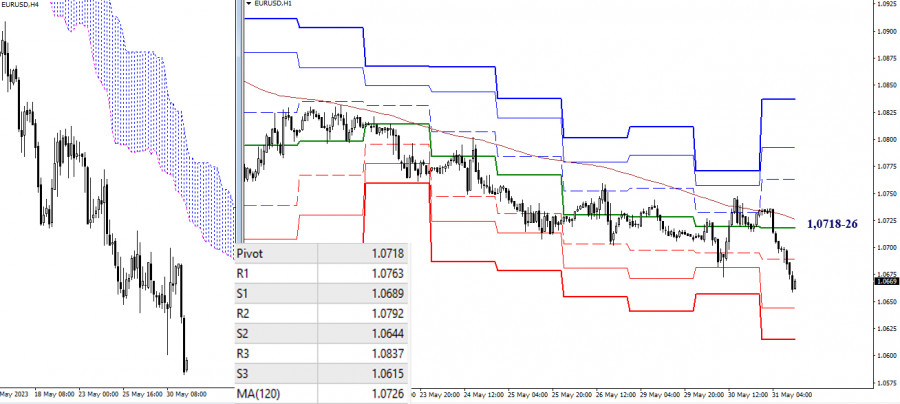
Yesterday, the weekly long-term trend once again fulfilled its task. By defending bearish interests, it did not allow the balance of power to shift. As a result, today, the bears set a new low and continued the development of the downward trend. The key bearish reference points within the day can be noted as the support of the classic pivot points (1.0644 - 1.0615). Today, the key levels maintain their role as resistances and converge around 1.0718–26 (central pivot point + weekly long-term trend). Consolidation above and a reversal of the movement can shift the main advantage to the bulls' side. The resistance levels of the classic pivot points (1.0763 - 1.0792 - 1.0837) will serve as targets for the upward movement in this case.

***

GBP/USD

This image is no longer relevant

Higher timeframes

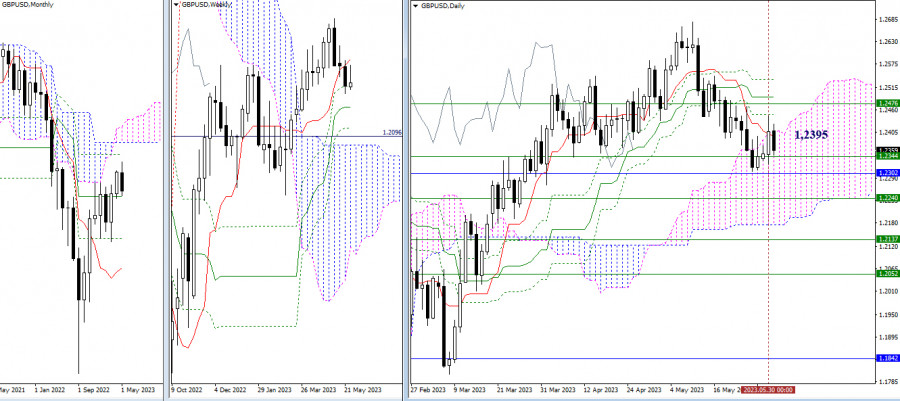
Yesterday, the bulls managed to execute a corrective rise to the daily short-term trend (1.2395) and the influence zone of the next level of the daily cross (1.2449). Furthermore, upward reference points can be noted at 1.2476 (weekly short-term trend) and 1.2492 - 1.2536 (final levels of the daily cross). The nearest supports continue to be the weekly (1.2344) and monthly (1.2302) levels.

This image is no longer relevant

H4 - H1

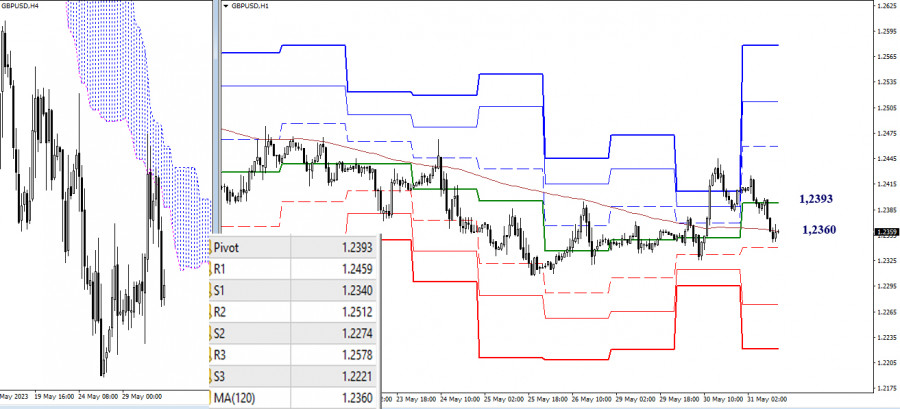
Yesterday's rise allowed the bulls to gain the upper hand on the lower timeframes, but today the pair is again testing the key level—the weekly long-term trend (1.2360). This level is responsible for the distribution of forces. Working above the weekly trend usually strengthens bullish sentiment. The reference points for the bulls within the day can be identified at 1.2459 - 1.2512 - 1.2578 (resistances of the classic pivot points). However, if the pair trades below the weekly trend, a bearish movement is to be expected. The reference points for downward movement within the day are 1.2340 - 1.2274 - 1.2221 (supports of the classic pivot points).

The technical analysis of the situation uses:

Higher timeframes - Ichimoku Kinko Hyo (9.26.52) + Fibo Kijun levels

Lower timeframes - H1 - Pivot Points (classic) + Moving Average 120 (weekly long-term trend)

Gana con los cambios en el valor de las criptomonedas con InstaForex.
Descarga MetaTrader 4 y abre tu primera operación.
  • Grand Choice
    Contest by
    InstaForex
    InstaForex always strives to help you
    fulfill your biggest dreams.
    UNIRSE AL CONCURSO
  • Depósito al azar
    ¡Haga un depósito en su cuenta de $3,000 y obtenga $9000 más!
    ¡En Mayo, sorteamos $9000 dentro de la campaña Depósito afortunado!
    Obtenga la oportunidad de ganar depositando $3,000 en una cuenta de operaciones. Tras haber cumplido esta condición, se convertirá en un participante de la campaña.
    UNIRSE AL CONCURSO
  • Opere de forma inteligente, gane un dispositivo
    Recargue su cuenta con al menos $500, regístrese en el concurso y tenga la oportunidad de ganar dispositivos móviles.
    UNIRSE AL CONCURSO
  • 100% de bonificación
    Su oportunidad única de obtener un bono del 100 % en su depósito
    OBTENER BONO
  • 55% de bonificación
    Solicite un bono del 55% en cada depósito
    OBTENER BONO
  • 30% de bonificación
    Reciba un bono del 30% cada vez que recargue su cuenta
    OBTENER BONO

Recommended Stories

¿No puede hablar ahora mismo?
Ingrese su pregunta en el chat.
Widget callback