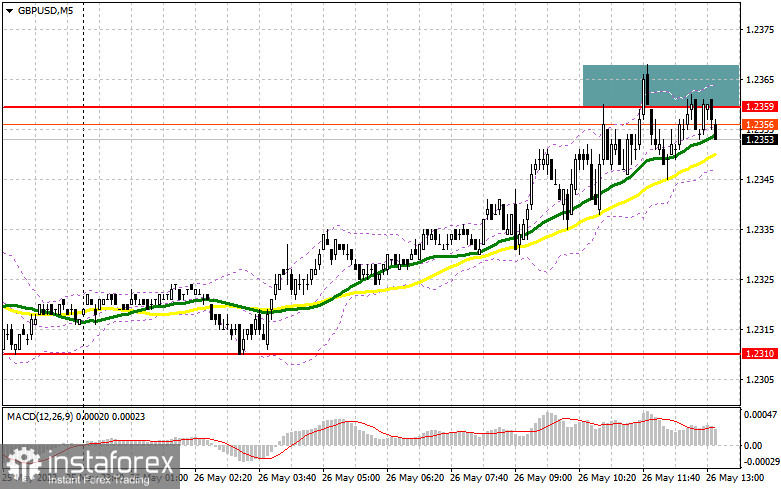
In my morning forecast, I drew attention to the level of 1.2359 and recommended making trading decisions based on it. Let's look at the 5-minute chart and analyze what happened there. The rise and the formation of a false breakout resulted in a sell signal, but there hasn't been a significant downward movement yet. However, it's too early to discount the bears as trading continues below 1.2359. The technical picture for the second half of the day remains unchanged.
To open long positions on GBP/USD, the following is required:
Bulls will break above 1.2359 in the second half of the day, so I don't expect a significant downward movement from this level. If sellers were willing to sell, the pound would have dropped by 20-25 points. The monthly retail sales growth data in the UK only slightly support the buyers, but significant growth has yet to occur. However, considering the day's opening level, the upward movement was quite good. During the US session, we expect figures on changes in US personal income and expenditure levels. Still, the most interesting will be the personal consumption expenditure index, the preferred inflation indicator of the Federal Reserve. An increase in the index may lead to a decline in the GBP/USD pair, while a decrease will allow the pound to rise from its lows and form an upward correction at the end of the week.
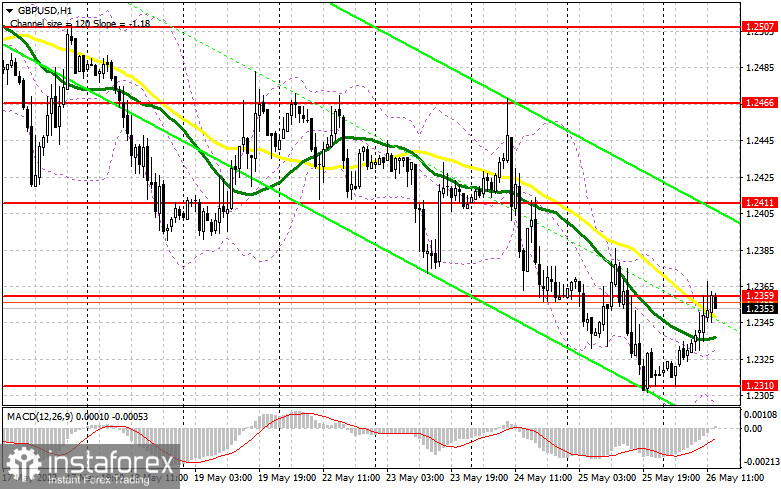
I will continue to act only on the downside, as going against the bearish market, especially at daily highs, is not the best idea. Only after a false breakout around the new support level of 1.2310 can we consider buying, leading to a surge in the pair towards 1.2359. Breaking through and testing the range from top to bottom will provide an additional signal to open long positions and strengthen the presence of bulls in the market with a surge towards 1.2411. The ultimate target will be around 1.2466, where I will take profits. If there is a decline toward monthly lows and a complete lack of activity from buyers at 1.2310, I will postpone buying until the next update of the monthly minimum at 1.2255. I will also open long positions there only on a false breakout. I plan to buy GBP/USD immediately on a rebound only from the minimum of 1.2192 with a target of a 30-35 point correction intra-day.
To open short positions on GBP/USD, the following is required:
Sellers defended 1.2359, but that's about it. In the second half of the day, the most important thing is to attend this level. Only the third false breakout at 1.2359 will give confidence to sellers, providing a selling signal with a downward movement toward the monthly minimum of 1.2310. Breaking through and testing the range from bottom to top will strengthen the bearish trend, forming a signal to open short positions with a decline toward 1.2255. The ultimate target remains the minimum of 1.2192, where I will take profits. In the case of GBP/USD growth and a lack of activity at 1.2359, which is likely to happen, sellers' stop orders will come into play, leading to a further upward correction in the pair. In such a case, I will postpone selling until testing the resistance at 1.2411. A false breakout there will be the entry point for short positions. If there is no downward movement from 1.2411, I will sell GBP/USD on a rebound from 1.2466, but only expecting a 30-35 point correction intra-day.
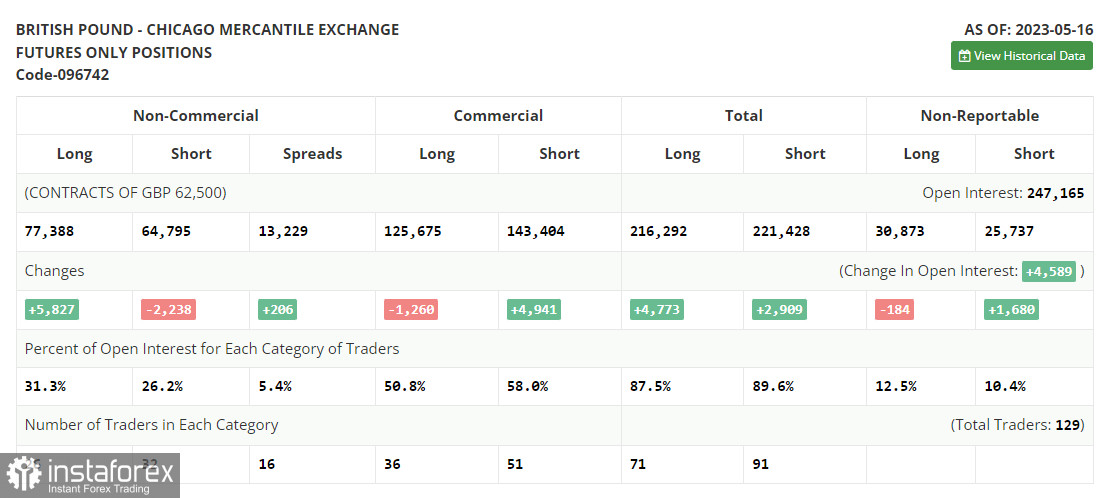
The COT (Commitment of Traders) report for May 16 showed an increase in long positions and a decrease in short positions. The correction of the British pound has been quite significant, and the pair is trading at very attractive prices, as reflected in the report. Once the issue with the US debt limit is resolved, the demand for risk assets will return, and the pound will be able to recover quite substantially. Remember that the Federal Reserve plans to pause its cycle of interest rate hikes, which will also put pressure on the US dollar. The latest COT report mentioned that non-commercial short positions decreased by 2,238 to 64,795, while non-commercial long positions increased by 5,827 to 77,388. This led to an increase in the non-commercial net position to 12,593 compared to 4,528 the previous week. The weekly price declined to 1.2495 from 1.2635.
Indicator signals:
Moving averages
Trading is conducted around the 30-day and 50-day moving averages, indicating market uncertainty.
Note: The period and prices of the moving averages discussed by the author are based on the hourly chart (H1) and differ from the general definition of classical daily moving averages on the daily chart (D1).
Bollinger Bands
In case of an upward movement, the upper boundary of the indicator around 1.2360 will act as resistance.
Description of indicators:
• Moving average (determines the current trend by smoothing volatility and noise). Period 50. Marked in yellow on the chart.
• Moving average (determines the current trend by smoothing volatility and noise). Period 30. Marked in green on the chart.
• MACD indicator (Moving Average Convergence/Divergence) - Fast EMA period 12, Slow EMA period 26, SMA period 9.
• Bollinger Bands - Period 20.
• Non-commercial traders - speculators such as individual traders, hedge funds, and large institutions using the futures market for speculative purposes and meeting certain requirements.
• Long non-commercial positions represent the total long open positions of non-commercial traders.
• Short non-commercial positions represent the total short open positions of non-commercial traders.
• Net non-commercial position is the difference between short and long positions of non-commercial traders.