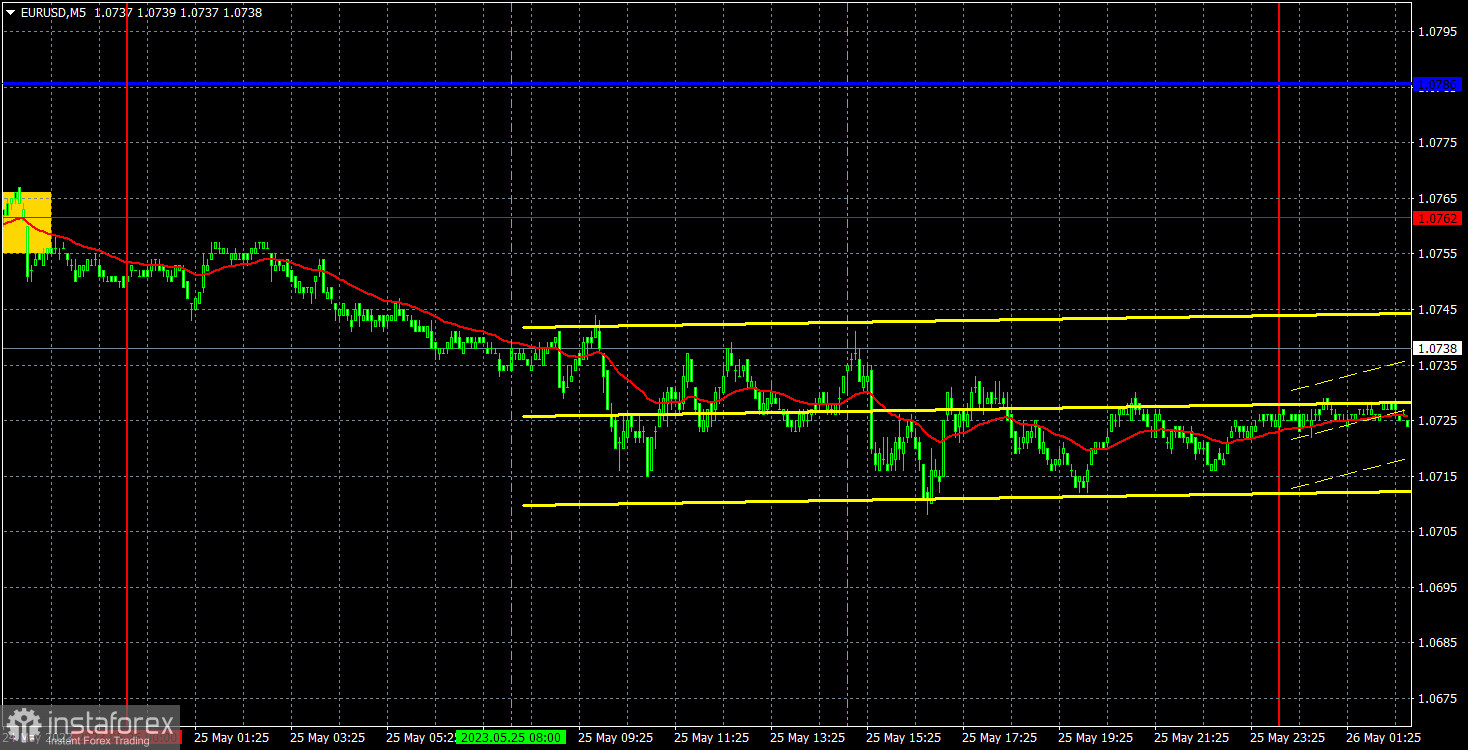
Analysis of EUR/USD 5M.
During the American and European sessions, the price practically did not decrease, it moved sideways. The main (if I can say so about a 20-decline) movement occurred during the Asian trading session. After that, it traded sideways. I have mentioned many times that despite a strong bearish bias, the intraday changes in the price were weak. The pair constantly rebounds but volatility is already low. The pair passes 50 pips a day. Even with 5 pullbacks, it is difficult to make a profit on such movements. Therefore, it is better to trade now according to a medium-term trend.
There were no signals yesterday. Maybe it's even for the best. The US revealed reports on the second estimate of GDP and initial jobless claims. Both turned out to be stronger than forecasts. So, they could facilitate an upward movement of the US currency. What was the market reaction? Currently, this is not the most crucial thing. Everything depends on the intraday movement. The trajectory of the pair is weak and it is not suitable for intraday trading.
COT report:
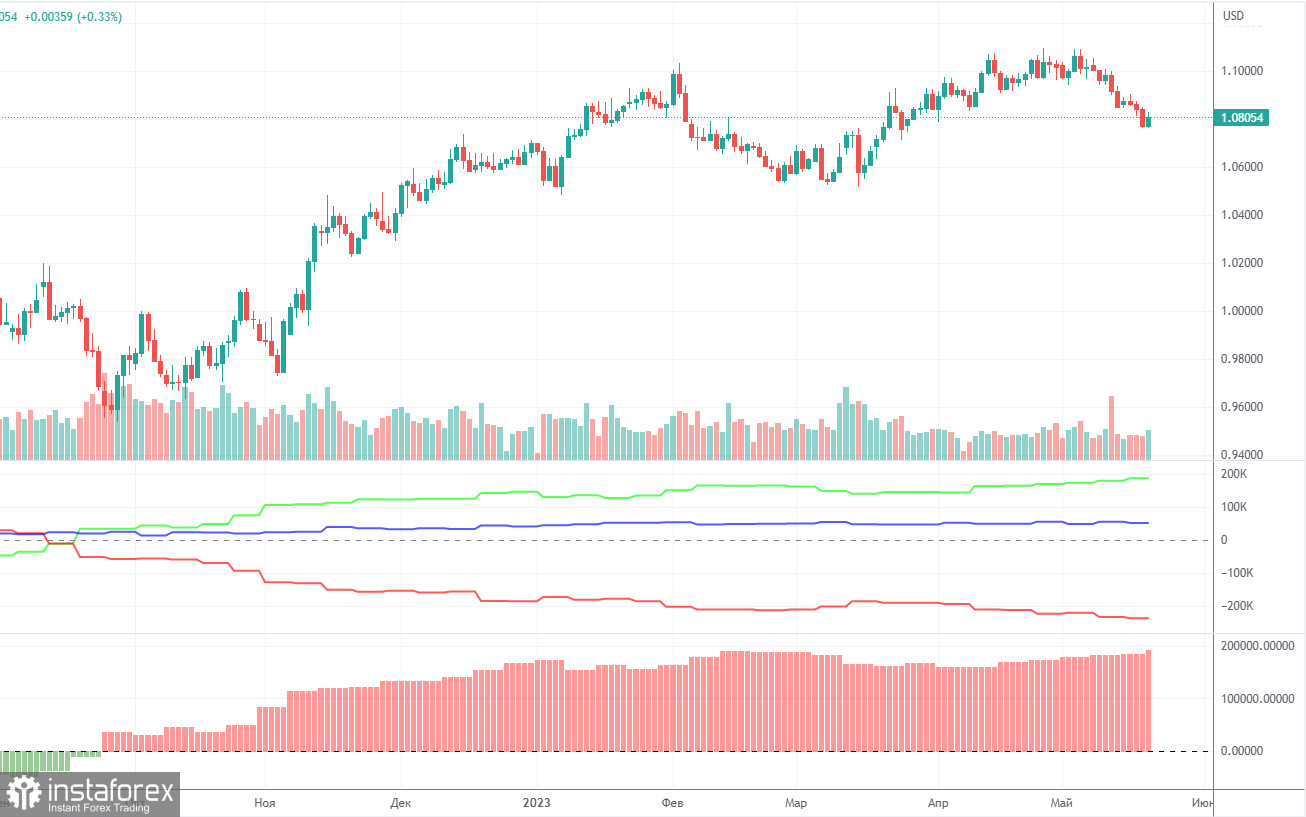
On Friday, a new COT report was released for May 16th. Over the past 9 months, the COT report data has been fully corresponding to the market situation. According to the chart, the net position of large traders (the second indicator) started to rise in September 2022. Around the same time, the European currency also began to rise. Currently, the net position of non-commercial traders, the bullish position, remains very high and continues to rise, just like the European currency itself.
We have already drawn traders' attention to the fact that a relatively high value of the net position suggests the imminent end of the uptrend. This is indicated by the first indicator, where the red and green lines are far away from each other, which often precedes the end of a trend. The euro attempted to start declining a few months ago but there was only a rebound. During the last reporting week, the number of buy contracts among the non-commercial group decreased by 1,600, while the number of short positions dropped by 9,600. Accordingly, the net position jumped again by 8,000 contracts. The number of buy contracts exceeds the number of sell contracts among non-commercial traders by 187,000 This is a very large gap. The difference is more than threefold. The correction is still looming (and perhaps already underway), so even without the COT reports, it is clear that the pair should decline.
Analysis of EUR/USD on 1H.
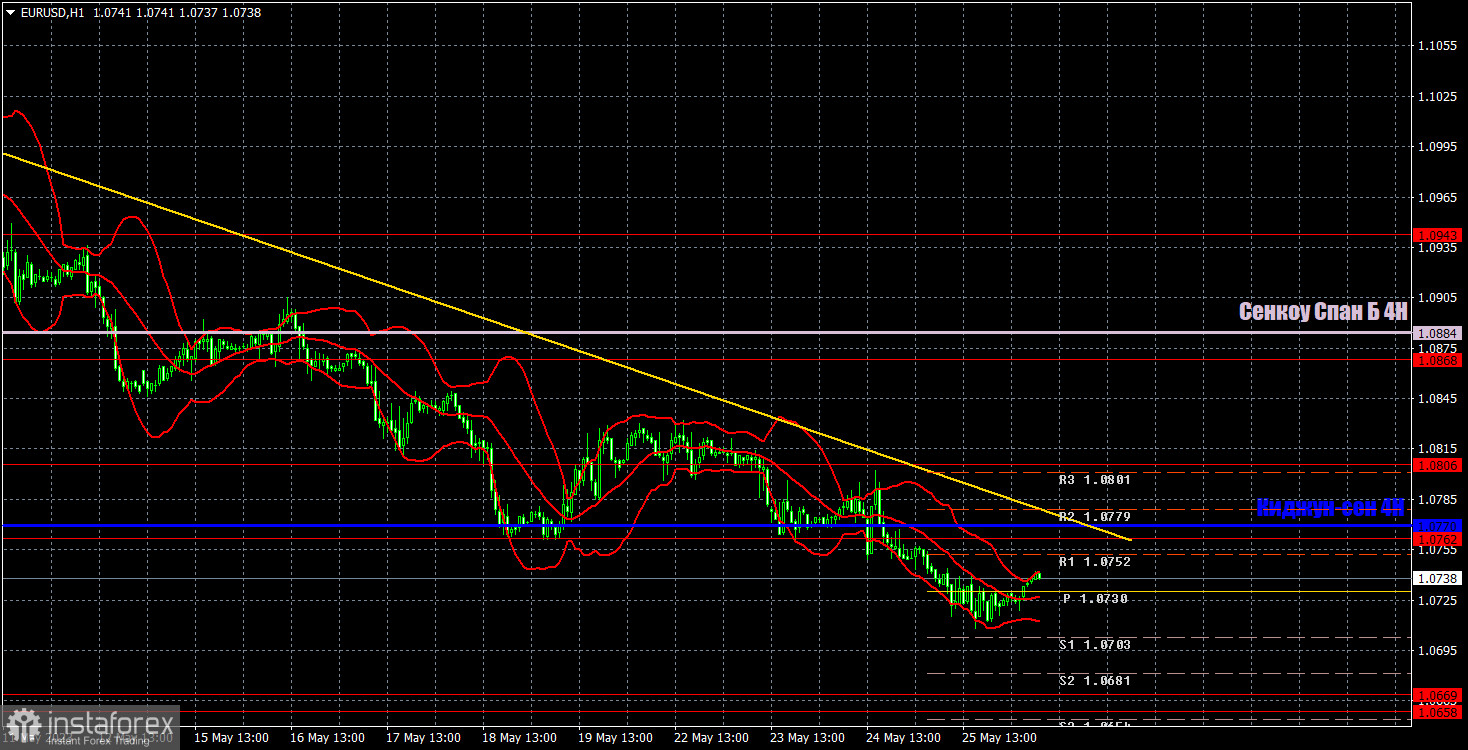
On the hourly time frame, the pair continued its downward movement. The trend is strong. The trend line is relevant. The price is located below the lines of the Ichimoku indicator. However, the pair loses 20-30 pips a day at best. It indicates that bears are in control as the fall occurs every day. Nevertheless, the movements are so weak that traders should keep their positions for several days if they want to make a profit.
On May 25, one should pay attention to the following levels – 1.0537, 1.0581, 1.0658-1.0669, 1.0762, 1.0806, 1.0868, 1.0943, 1.1092 as well as the Senkou Span B (1.0884) and Kijun-sen (1.0770) lines. The lines of the Ichimoku indicator may move throughout the day, so this should be taken into account when determining trading signals. There are also support and resistance levels, but no signals are formed around them. Bounces and breakouts of key levels and lines can also give signals. Don't forget to set a stop loss order at breakeven if the price moves in the right direction by 15 pips. This will protect against potential losses if the signal turns out to be false.
Today, ECB's chief economist Philippe Plein will deliver a speech. The US will unveil several economic reports, namely the PCE Price Index, the University of Michigan Consumer Sentiment Index, the Producer Price Index, and durable goods orders. However, traders are likely to ignore the reports. They could affect the movement of the pair but volatility is unlikely to grow today.
What do we see on the trading chart:
Support and resistance levels (resistance/support) are thick red lines where price movement may end. They are not sources of trading signals.
Kijun-sen and Senkou Span B lines are lines of the Ichimoku indicator transferred from the 4-hour time frame to the hourly time frame. They are strong lines.
Extreme levels are thin red lines from which the price previously rebounded. They are sources of trading signals.
Yellow lines are trendlines, trend channels, and any other technical patterns.
Indicator 1 on the COT chart reflects the size of the net position for each category of traders.
Indicator 2 on the COT charts points to the size of the net position for the non-commercial group.