Analyzing Thursday's trades:
EUR/USD on 30M chart
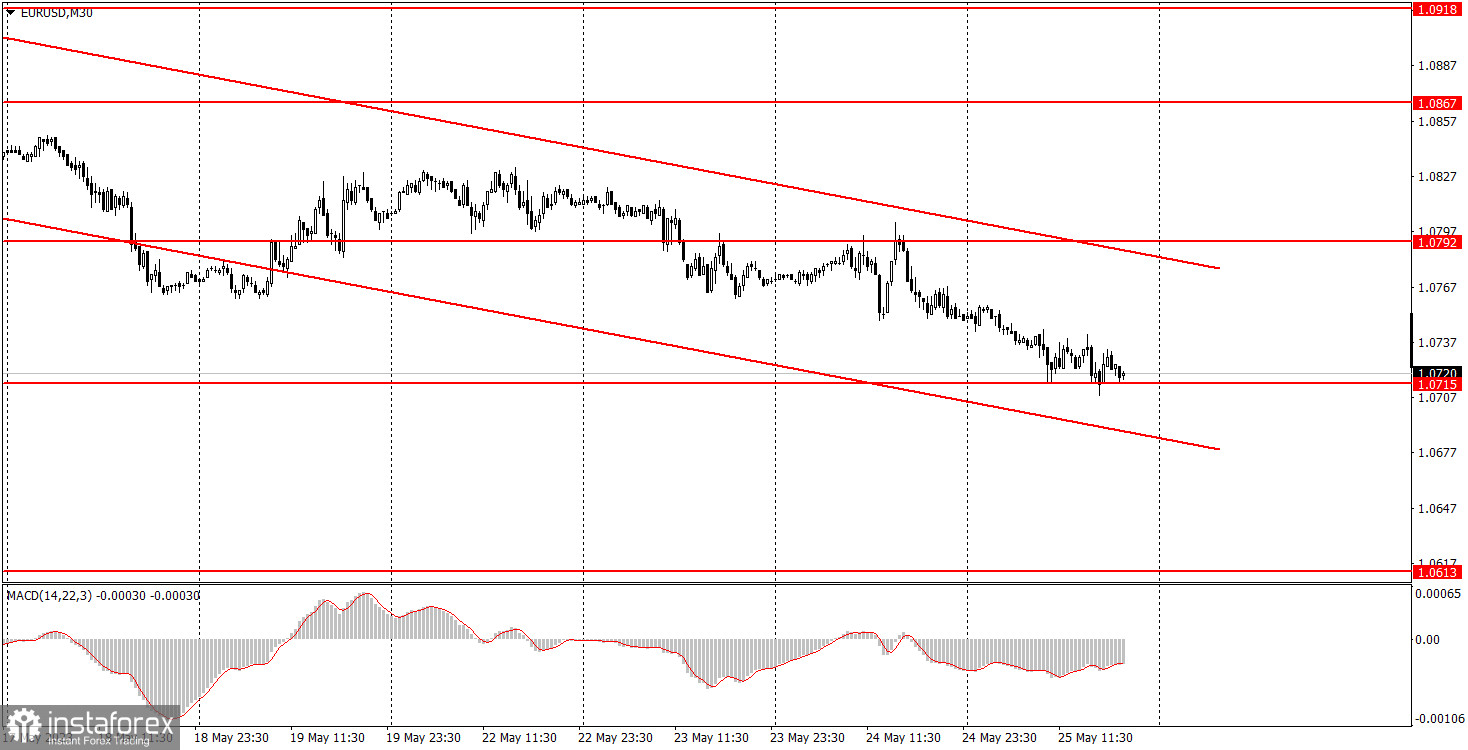
EUR/USD extended its downward movement on Thursday, following the current trend. Volatility remained very low, with only a 50-pip range. However, the euro continues to steadily trade lower as it had previously shown illogical growth for a long time. Most factors currently favor a very strong US dollar, so we believe everything is going according to plan. The macroeconomic backdrop of the day was also unequivocally in favor of the dollar. In the morning, Germany released its final estimate of GDP for the first quarter, which was 0.3% worse than expected. In the second half of the day, the second estimate of the US GDP report was released, which was 0.2% better than expected. Therefore, these two interesting events of the day supported the US currency, although they weren't exactly that important. This would explain the weak movement, which remained bearish.
EUR/USD on 5M chart
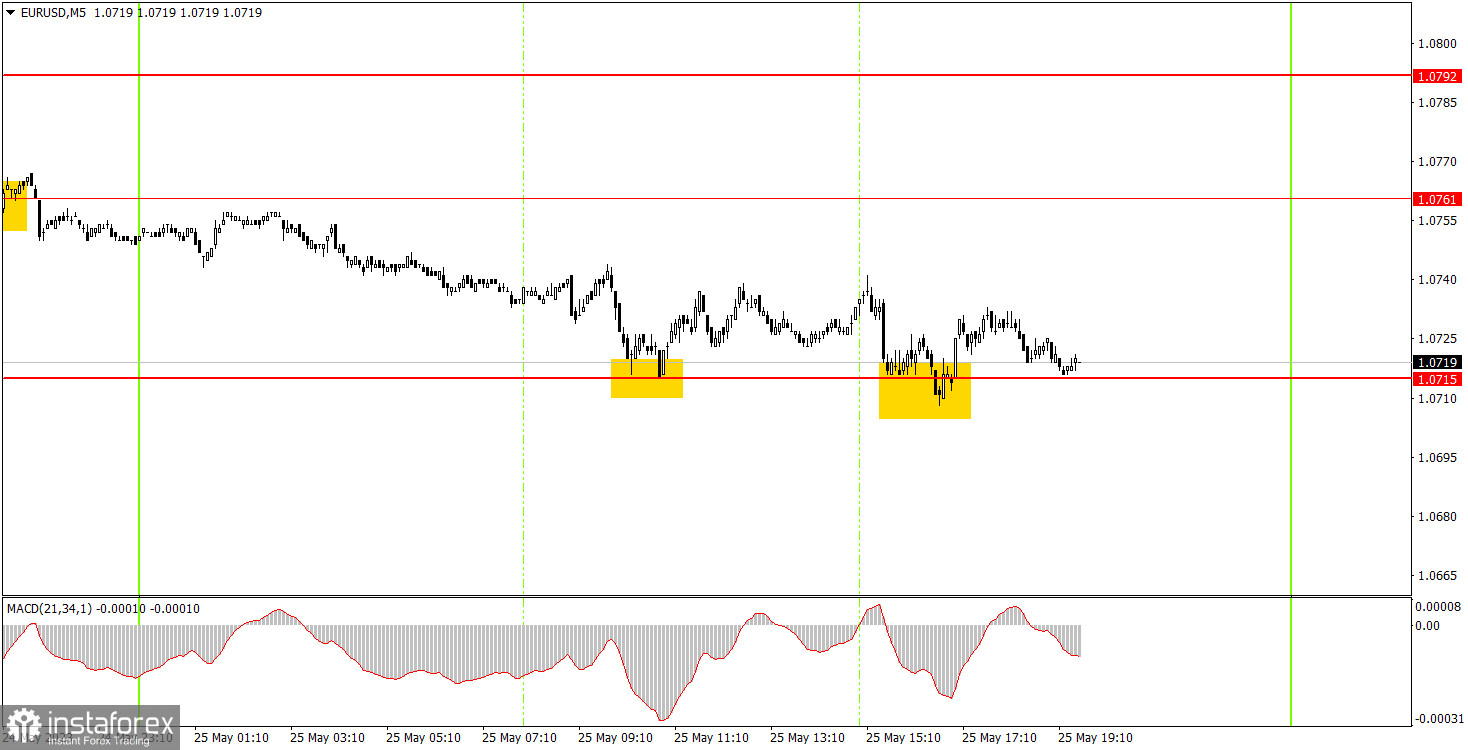
The 5M chart shows a clearer picture of the pair's performance. It was very difficult to expect strong signals and high profits with just a 50-pip volatility. Only two trading signals were formed, both rebounds from the 1.0715 level. In the first case, the price reluctantly moved up by 15 pips, allowing beginners to set breakeven to stop loss, which closed the trade. You could ignore the second signal since it was already clear that we had a low relative level of volatility and there was almost no trend-driven movement. Therefore, it was another day when trading on the 5M chart was extremely difficult and inconvenient. Unfortunately, despite a clear downtrend, intraday trading leaves much to be desired. It is currently best to trade in the medium-term.
Trading tips on Friday:
As seen on the 30M chart, the pair continued moving downward. The bearish trend has been developing for 2 weeks already, which totally matches our expectations. In the nearest future, the upward correction is likely to start, though the descending channel still indicates continuation of the downward trend. The US dollar is rightfully rising regardless of the fundamental and macroeconomic backdrop. The key levels on the 5M chart are 1.0607-1.0613, 1.0715, 1.0761, 1.0792, 1.0857-1.0867, 1.0918-1.0933. A stop loss can be set at a breakeven point as soon as the price moves 15 pips in the right direction. There are no important events scheduled in the European Union on Friday, while the US will release four relatively insignificant reports: the University of Michigan Consumer Sentiment Index, Durable Goods Orders, Personal Income and Spending, and the Producer Price Index. Collectively, they may influence market sentiment and trigger reactions.
Basic rules of the trading system:
1) The strength of the signal depends on the time period during which the signal was formed (a rebound or a break). The shorter this period, the stronger the signal.
2) If two or more trades were opened at some level following false signals, i.e. those signals that did not lead the price to Take Profit level or the nearest target levels, then any consequent signals near this level should be ignored.
3) During the flat trend, any currency pair may form a lot of false signals or do not produce any signals at all. In any case, the flat trend is not the best condition for trading.
4) Trades are opened in the time period between the beginning of the European session and until the middle of the American one when all deals should be closed manually.
5) We can pay attention to the MACD signals in the 30M time frame only if there is good volatility and a definite trend confirmed by a trend line or a trend channel.
6) If two key levels are too close to each other (about 5-15 pips), then this is a support or resistance area.
How to read charts:
Support and Resistance price levels can serve as targets when buying or selling. You can place Take Profit levels near them.
Red lines are channels or trend lines that display the current trend and show which direction is better to trade.
MACD indicator (14,22,3) is a histogram and a signal line showing when it is better to enter the market when they cross. This indicator is better to be used in combination with trend channels or trend lines.
Important speeches and reports that are always reflected in the economic calendars can greatly influence the movement of a currency pair. Therefore, during such events, it is recommended to trade as carefully as possible or exit the market in order to avoid a sharp price reversal against the previous movement.
Beginners should remember that every trade cannot be profitable. The development of a reliable strategy and money management are the key to success in trading over a long period of time.