empty
24.10.2023 11:09 AM
Technical Analysis of EUR/USD for October 24, 2023

Technical Market Outlook:

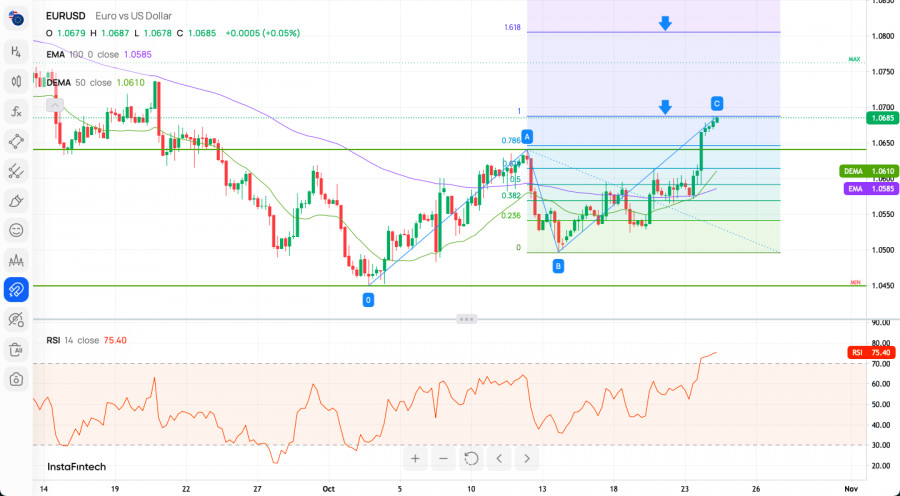
The EUR/USD pair has been seen coming off the local high located at the level of 1.0695 after the ABC corrective pattern had been completed. Moreover, the wave C of the ABC pattern has hit the 100% extension of the wave A, so there is another indication of a possible down trend resumption. The nearest technical support is seen at the level of 1.0640 and the nearest technical resistance is located at the level of 1.0737. The next target for bulls is seen at the level of 1.0737 (swing high from September 20th). The next target for bears is the technical support located at the level of 1.0614 and 1.0595, but in order to do this, they need to break out below the intraday support. If the latter is violated, then the key short-term technical support located at the level of 1.0449 would be exposed for the test.

This image is no longer relevant

Weekly Pivot Points:

WR3 - 1.06231

WR2 - 1.06012

WR1 - 1.05872

Weekly Pivot - 1.05793

WS1 - 1.05653

WS2 - 1.05574

WS3 - 1.05355

Trading Outlook:

Since the beginning of October 2022 the EUR/USD is in the corrective cycle to the upside, but the main, long-term trend remains bearish. This corrective cycle was terminated at the level of 1.1286 which is 61% Fibonacci retracement level and the market reversed lower. The intermediate down move is 16 weeks long now and there is no indication if the down move termination yet. There is still a room to the downside on the RSI indication on the weekly time frame as well.

Sebastian Seliga,
InstaForex के विश्लेषणात्मक विशेषज्ञ
© 2007-2025
Summary
Urgency
Analytic
Sebastian Seliga
Start trade
Earn on cryptocurrency rate changes with InstaForex
Download MetaTrader 4 and open your first trade
  • Grand Choice
    Contest by
    InstaForex
    InstaForex always strives to help you
    fulfill your biggest dreams.
    कॉन्टेस्ट में हिस्सा लें

अनुशंसित लेख

24 जुलाई, 2025 को EUR/USD का पूर्वानुमान

बुधवार को, EUR/USD जोड़ी 1.1712 पर 127.2% फिबोनाची रिट्रेसमेंट स्तर से उछली, यूरो के पक्ष में पलटी, और 1.1802 के स्तर की ओर बढ़ती रही। 1.1802 से उछाल अमेरिकी डॉलर

Samir Klishi 19:49 2025-07-24 UTC+2

24 जुलाई, 2025 को GBP/USD का पूर्वानुमान

प्रति घंटा चार्ट पर, GBP/USD जोड़ी बुधवार को 1.3530 पर 61.8% फिबोनाची रिट्रेसमेंट स्तर से ऊपर समेकित हुई और 1.3579 पर 50.0% के स्तर तक पहुँच गई। आज, इस स्तर

Samir Klishi 19:46 2025-07-24 UTC+2

24 से 27 जुलाई, 2025 के लिए बिटकॉइन के ट्रेडिंग सिग्नल: $117,000 के ऊपर खरीदें (6/8 मरे - 21 SMA)।

ईगल इंडिकेटर 21 जुलाई से सकारात्मक संकेत दिखा रहा है। संभावना है कि आने वाले दिनों में बिटकॉइन में कोई भी वापसी खरीदारी जारी रखने के लिए संकेत के रूप

Dimitrios Zappas 09:42 2025-07-24 UTC+2

यदि S&P 500 इंडेक्स का सपोर्ट स्तर 6327.24 आज के नीचे की ओर सुधार को सहन कर लेता है, तो यह फिर से मजबूती की ओर ले जाएगा। गुरुवार, 24 जुलाई, 2025।

S&P 500 इंडेक्स – गुरुवार, 24 जुलाई, 2025। गोल्डन क्रॉस EMA(50) के EMA(200) के ऊपर होने के कारण खरीदार काफी हावी हैं। हालांकि RSI(14) संकेतक एक तटस्थ तेजी के स्तर

Arief Makmur 09:37 2025-07-24 UTC+2

हालांकि खरीदार अब भी नैस्डैक 100 इंडेक्स पर हावी हैं, लेकिन आज, गुरुवार, 24 जुलाई, 2025 को नीचे की ओर सुधार की संभावना है।

नैस्डैक 100 इंडेक्स – गुरुवार, 24 जुलाई, 2025। नैस्डैक 100 इंडेक्स की कीमत की चाल और RSI(14) इंडिकेटर के बीच विचलन प्रकट होने से संकेत मिलता है कि #NDX के

Arief Makmur 09:32 2025-07-24 UTC+2

AUD/USD के लिए सभी तकनीकी संकेतक स्थिति बुधवार, 23 जुलाई, 2025 को महत्वपूर्ण मजबूती का संकेत देती है।

AUD/USD – बुधवार, 23 जुलाई, 2025. AUD/USD के सभी तकनीकी संकेतक महत्वपूर्ण मजबूती का संकेत दे रहे हैं, जिसमें 50-दिवसीय मूविंग एवरेज (EMA) और 200-दिवसीय मूविंग एवरेज (EMA) का गोल्डन

Arief Makmur 19:58 2025-07-23 UTC+2

USD/JPY की भविष्यवाणी - 23 जुलाई, 2025

आज सुबह, कीमत 146.29 के समर्थन स्तर तक पहुंची और निर्णायक रूप से ऊपर की ओर मुड़ी। यह देखना बाकी है कि क्या यह दृढ़ता 148.66 को तोड़ने के लिए

Laurie Bailey 07:20 2025-07-23 UTC+2

GBP/USD – 22 जुलाई: पाउंड ने मंदी का रुख तोड़ा

प्रति घंटा चार्ट पर, GBP/USD जोड़ी ने सोमवार को पाउंड के पक्ष में एक नया उलटफेर किया और 76.4% फिबोनाची स्तर से ऊपर 1.3470 पर समेकित हुई, जिससे पिछले दो

Samir Klishi 19:19 2025-07-22 UTC+2

22-25 जुलाई, 2025 के लिए BITCOIN ट्रेडिंग सिग्नल: $115,625 से ऊपर खरीदारी करें (/8 Murray - 21 SMA)।

बिटकॉइन लगभग $117,522 के स्तर पर ट्रेड कर रहा है, जो $116,070 के निचले स्तर से वापस उछला है। कल, यूरोपियन सेशन के दौरान, बिटकॉइन ने $119,500 का उच्च स्तर

Dimitrios Zappas 09:16 2025-07-22 UTC+2

GBP/USD में अपनी सबसे नजदीकी रेसिस्टेंस स्तरों की ओर मजबूती आने की संभावना है, मंगलवार, 22 जुलाई 2025 को।

GBP/USD – मंगलवार, 22 जुलाई, 2025 GBP/USD बुलिश स्थिति में बना हुआ है, हालांकि नीचे की ओर सुधार संभव है। फिर भी, जब तक अस्थायी कमजोरी अपने सपोर्ट 2 स्तर

Arief Makmur 09:10 2025-07-22 UTC+2
अभी बात नहीं कर सकते?
अपना प्रश्न पूछें बातचीत.
Widget callback
 

Dear visitor,

Your IP address shows that you are currently located in the USA. If you are a resident of the United States, you are prohibited from using the services of InstaFintech Group including online trading, online transfers, deposit/withdrawal of funds, etc.

If you think you are seeing this message by mistake and your location is not the US, kindly proceed to the website. Otherwise, you must leave the website in order to comply with government restrictions.

Why does your IP address show your location as the USA?

  • - you are using a VPN provided by a hosting company based in the United States;
  • - your IP does not have proper WHOIS records;
  • - an error occurred in the WHOIS geolocation database.

Please confirm whether you are a US resident or not by clicking the relevant button below. If you choose the wrong option, being a US resident, you will not be able to open an account with InstaForex anyway.

We are sorry for any inconvenience caused by this message.