empty
09.03.2023 04:06 PM
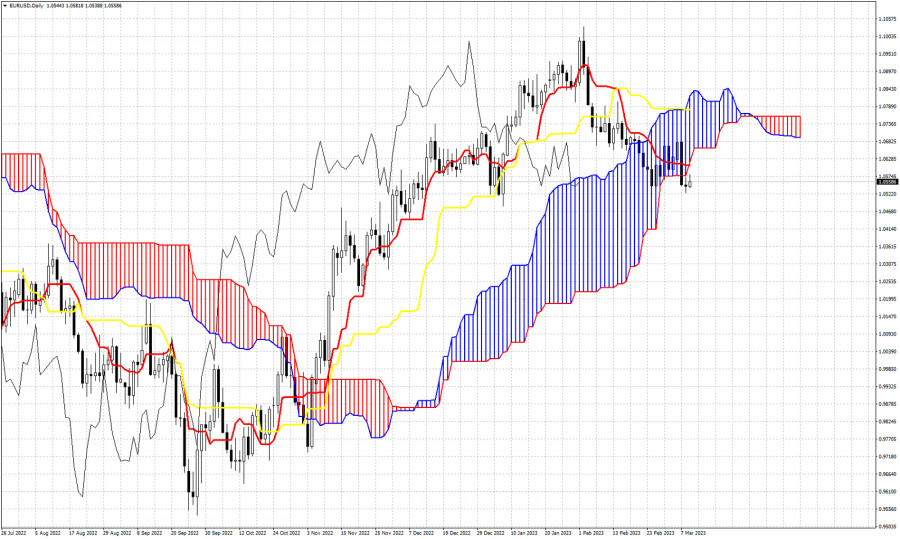
Ichimoku cloud indicator analysis on EURUSD for March 9th, 2023.

This image is no longer relevant

EURUSD is trading around 1.0570, off the recent low of 1.0525. According to the Ichimoku cloud indicator in the Daily chart trend has turned bearish as price has broken below the Daily Kumo (cloud). In the 4 hour chart as we showed in previous posts, trend is also bearish as price is below the Kumo also. Usually when price breaks above or below the cloud a back test is followed. This is not necessary to see but also very common. The tenkan-sen (red line indicator) is at 1.0610 where we also find the lower cloud boundary. So a bounce towards that level is very likely. With the US Non-Farm Payrolls announced tomorrow, we expect a rise in volatility at the last trading day of the week. A break above 1.0610 could help bulls push price higher towards the upper cloud boundary at 1.0780 where we also find the kijun-sen (yellow line indicator). A rejection between 1.06-1.07 will be a bearish sign.

Alexandros Yfantis,
InstaForex के विश्लेषणात्मक विशेषज्ञ
© 2007-2025
समय सीमा चुनें
5
मिनट
15
मिनट
30
मिनट
1
घंटा
4
घंटे
1
दिन
1
सप्ताह
Earn on cryptocurrency rate changes with InstaForex
Download MetaTrader 4 and open your first trade
  • Grand Choice
    Contest by
    InstaForex
    InstaForex always strives to help you
    fulfill your biggest dreams.
    कॉन्टेस्ट में हिस्सा लें

अनुशंसित लेख

13 नवंबर, 2023 के लिए EURUSD पर इचिमोकू क्लाउड संकेतक विश्लेषण।

EURUSD 4 घंटे के चार्ट में इचिमोकू क्लाउड संकेतक के ऊपर 1.0688 के आसपास कारोबार कर रहा है। अल्पावधि रुझान तेजी का बना हुआ है क्योंकि कीमत अभी भी कुमो

Alexandros Yfantis 18:14 2023-11-13 UTC+2

1 नवंबर, 2023 के लिए USDJPY पर इचिमोकू क्लाउड संकेतक विश्लेषण।

USDJPY 151.30 के आसपास कारोबार कर रहा है। इचिमोकू क्लाउड संकेतक के अनुसार दैनिक प्रवृत्ति तेजी बनी हुई है। कुछ उच्च अस्थिरता वाले दिनों के बाद जहां कीमत ने किजुन-सेन

Alexandros Yfantis 19:03 2023-11-01 UTC+2

31 अक्टूबर 2023 के लिए EURUSD पर इचिमोकू क्लाउड संकेतक विश्लेषण।

EURUSD 1.0675 के पहले उच्च स्तर पर पहुंचने के बाद 1.0630 के आसपास कारोबार कर रहा है। दैनिक चार्ट में इचिमोकू क्लाउड संकेतक के अनुसार, रुझान मंदी का बना हुआ

Alexandros Yfantis 17:16 2023-10-31 UTC+2

6 अक्टूबर 2023 के लिए EURUSD पर इचिमोकू क्लाउड संकेतक विश्लेषण।

EURUSD 1.0509 के आसपास कारोबार कर रहा है। इससे पहले आज कीमत 1.0568 के उच्च स्तर पर कारोबार कर रही थी जहां हमें कम बादल सीमा प्रतिरोध मिलता है। कीमत

Alexandros Yfantis 19:21 2023-10-06 UTC+2

सितंबर 2023 के अंतिम सप्ताह के लिए सोने पर साप्ताहिक इचिमोकू क्लाउड संकेतक विश्लेषण।

अगस्त के मुकाबले सोने की कीमत नए निचले स्तर पर पहुंच रही है। जैसा कि हमने पिछली पोस्टों में बताया था, अल्पकालिक प्रवृत्ति मंदी बनी हुई है। आज हम इचिमोकू

Alexandros Yfantis 19:50 2023-09-28 UTC+2

23 अगस्त, 2023 के लिए सोने पर इचिमोकू क्लाउड संकेतक विश्लेषण।

सोने की कीमत लगातार तीसरे दिन सकारात्मक निकट अवधि गति में 1,900 डॉलर से ऊपर कारोबार कर रही है। दैनिक चार्ट में इचिमोकू क्लाउड के संदर्भ में, रुझान मंदी का

Alexandros Yfantis 18:05 2023-08-23 UTC+2

11 अगस्त, 2023 के लिए EURUSD पर इचिमोकू क्लाउड संकेतक विश्लेषण।

4 घंटे के चार्ट में इचिमोकू क्लाउड संकेतक के अनुसार EURUSD एक मंदी की अल्पकालिक प्रवृत्ति में है। कीमत ने हमें पहले ही कुमो (बादल) के नीचे 4 घंटे की

Alexandros Yfantis 19:46 2023-08-11 UTC+2

11 अगस्त, 2023 के लिए सोने पर साप्ताहिक इचिमोकू क्लाउड संकेतक विश्लेषण।

सोने में साप्ताहिक कैंडलस्टिक मंदी की चेतावनी दे रहा है। इस सप्ताह कीमत तेनकान-सेन (लाल रेखा संकेतक) और किजुन-सेन (पीली रेखा संकेतक) से नीचे कारोबार कर रही है। ये दोनों

Alexandros Yfantis 19:45 2023-08-11 UTC+2

20 जुलाई, 2023 के लिए सोने पर इचिमोकू क्लाउड संकेतक।

सोने की कीमत 1,968 डॉलर के आसपास कारोबार कर रही है, कीमत बादल प्रतिरोध पर अस्वीकृति के संकेत दिखा रही है और वर्तमान में कीमत एक बार फिर कुमो से

Alexandros Yfantis 18:54 2023-07-20 UTC+2

10 जुलाई, 2023 के लिए USDJPY पर इचिमोकू क्लाउड संकेतक विश्लेषण।

USDJPY एक बार फिर दबाव में है। पिछले सप्ताह कीमत कुमो (बादल) से नीचे टूट गई, जिससे 143.15 पर मंदी का संकेत मिला। हमारे विश्लेषण ने व्यापारियों को कीमत में

Alexandros Yfantis 19:27 2023-07-10 UTC+2
अभी बात नहीं कर सकते?
अपना प्रश्न पूछें बातचीत.
Widget callback
 

Dear visitor,

Your IP address shows that you are currently located in the USA. If you are a resident of the United States, you are prohibited from using the services of InstaFintech Group including online trading, online transfers, deposit/withdrawal of funds, etc.

If you think you are seeing this message by mistake and your location is not the US, kindly proceed to the website. Otherwise, you must leave the website in order to comply with government restrictions.

Why does your IP address show your location as the USA?

  • - you are using a VPN provided by a hosting company based in the United States;
  • - your IP does not have proper WHOIS records;
  • - an error occurred in the WHOIS geolocation database.

Please confirm whether you are a US resident or not by clicking the relevant button below. If you choose the wrong option, being a US resident, you will not be able to open an account with InstaForex anyway.

We are sorry for any inconvenience caused by this message.