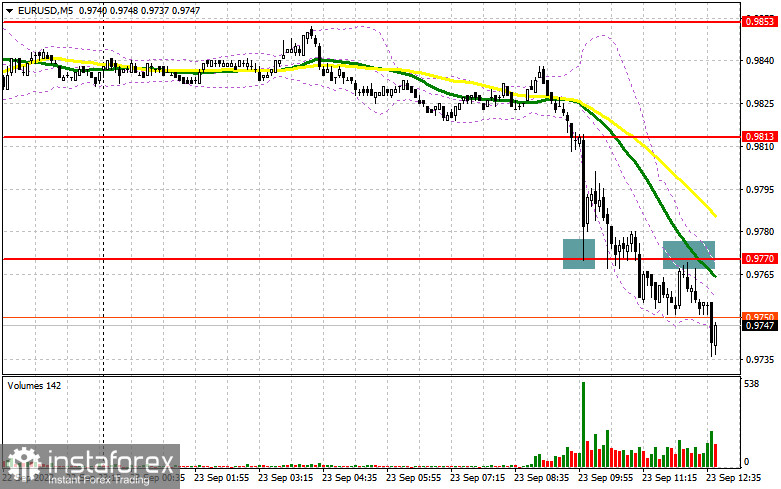
The euro expectedly fell below the yearly lows and continued its sharp decline. In my previous forecast, I drew your attention to the level of 0.9813 and 0.9770 and recommended entering the market from them. Let us have a look at the 5-minute chart and analyze the situation there. A breakthrough of 0.9813, on the background of the disappointing statistics on activity in the eurozone, gave a sell signal and caused another wave of decline, pushing the pair to a low of 0.9770. Bulls tried to catch the level and formed a false breakout with an entry point. A strong upward movement did not take place, and after the correction by 15 pips, the pressure on the pair returned. A breakthrough of 0.9770 and a top/bottom test gave another sell signal. At the time of writing, the pair was already down more than 35 pips. In the second half of the day, the technical picture changed slightly.
Long positions on EUR/USD:
During the US session, markets expect data on the manufacturing index, service sector business activity index, and US business activity composite, as well as a speech by Federal Reserve Chairman Jerome Powell. Obviously, weak US data may cause a slight correction in the euro but if the pressure is sustained, the whole focus will shift to the nearest support at 0.9723. Powell's statement is unlikely to seriously change the market direction, as he said everything that could be said on Wednesday. I do not recommend rushing to buy the euro. The optimal scenario for a set of long positions against the trend will be a false breakout near the new support at 0.9723. Only this will give a good entrance point, counting on the growth of the pair to 0.9770, the level of the first half of the day. A consolidation above this range and a top/bottom test is a buy signal, which will open the way to the area of 0.9813, from which the euro has been falling today. The next target is 0.9853, where traders may take profits. If the EUR/USD pair declines after a strong statistics release in the US and we see weak activity from bulls at 0.9723, the pair may quickly slide down to the low at 0.9680. From this level, I also recommend buying only on a false breakout. To open long positions on EUR/USD on a rebound, it is better to do this from the low at 0.9631, or even lower near 0.9600, allowing an upward intraday correction of 30-35 pips.
Short positions on EUR/USD:
Bears control the market but they can quickly lose control if we see weak US statistics, which is under the spotlight at the end of the week. A false breakout of the nearest resistance at 0.9770, which will give a sell signal to go down to 0.9723, will be the best scenario to open the short positions. A breakthrough and a fixation below 0.9723, after strong US statistics, as well as a reverse bottom/top test, like the one I analyzed above, will be an additional sell signal, triggering buyers' Stop Loss orders and opening the way to the yearly low at 0.9680. Support at 0.9631, where I recommend taking profit, will be the next target. If the EUR/USD pair moves up during the US session, and if there are no bears at 0.9770, a large upward correction is likely to begin, and the pair may start a rally. It would be better to postpone selling the euro until the pair reaches 0.9813. A false breakout will be a new starting entry point into short positions. It is possible to sell the euro on a rebound from a high of 0.9853, or higher from 0.9898, allowing a downward correction of 30-35 pips.
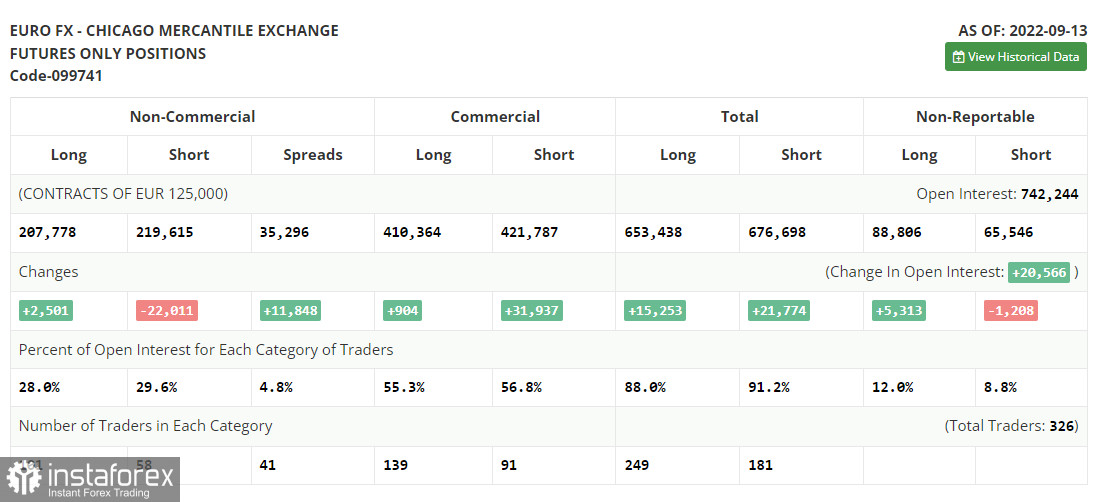
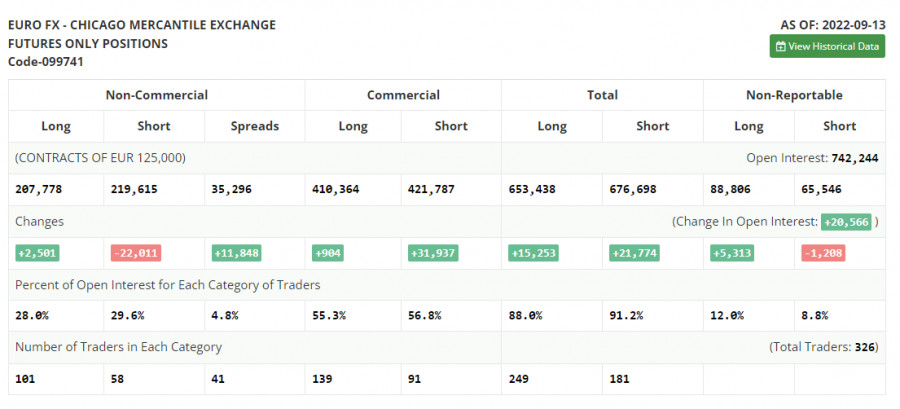
The COT report for September 13 logged a decrease in short positions and a slight increase in long positions. This suggests that the European Central Bank meeting and a sharp interest rate hike of 0.75% at once influenced traders, who preferred to lock in profits at current levels even despite the approaching meeting of the Federal Reserve. The US regulator is likely to raise rates by at least 0.75% this week but there are rumors in the market that some policymakers are in favor of a 100 basis point hike, or 1.0%, at once. This will lead to more bearish momentum and a new collapse of the European currency against the US dollar. Considering the US inflation data for August this year, we cannot rule out such a scenario. However, the European Central Bank is also no longer "sitting on the fence" and starts to catch up with the Fed, reducing the gap between the yields. This plays into the hands of long-term euro buyers who expect a recovery in demand for risky assets. The COT report showed that long non-commercials rose by 2,501 to 207,778, while short non-commercials declined by 22,011 to 219,615. As the week ended, the overall non-commercial net position remained negative but rose slightly to -11,832 from -36,349, indicating a continued upward correction in the pair. The weekly closing price rose to 0.9980 against 0.9917.
Indicator signals:
Moving averages
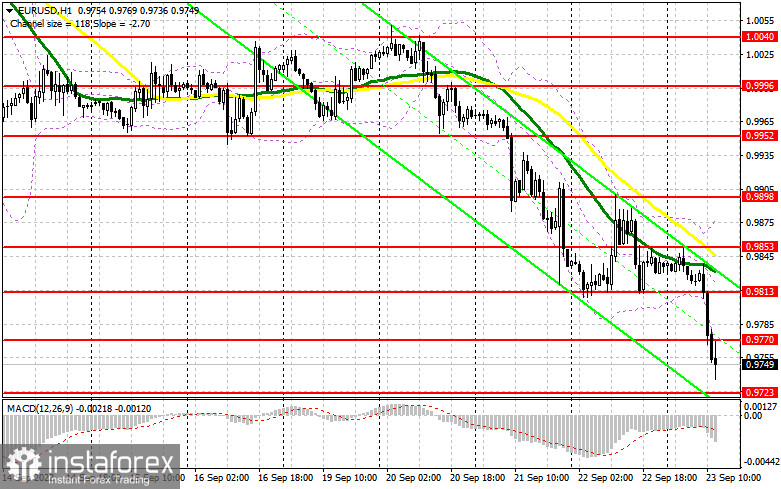
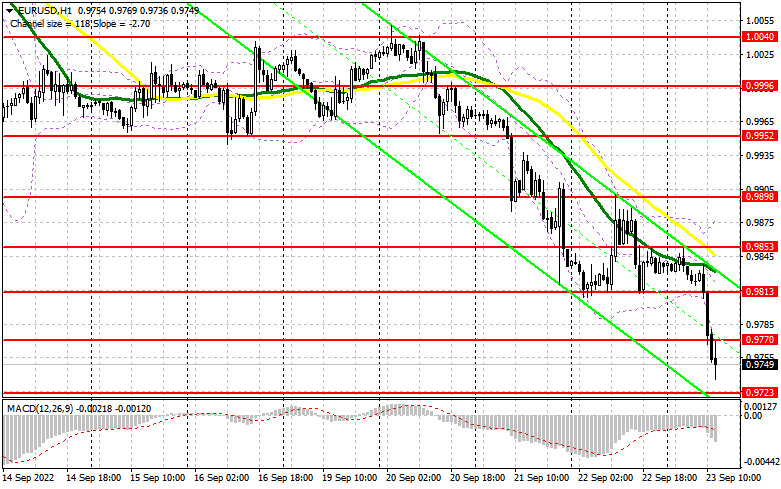
The pair is trading below the 30- and 50-day moving averages, indicating a further decline in the euro.
Note: Period and prices of moving averages are considered by the author on hourly chart H1 and differ from the common definition of classic daily moving averages on daily chart D1.
Bollinger Bands
If the pair grows, the upper boundary of the indicator at 0.9853 will act as resistance.
Indicators description
- Moving average defines the current trend by smoothing out volatility and noise. Period 50. Marked in yellow on the chart.
- Moving average defines the current trend by smoothing out volatility and noise. Period of 30. Marked in green on the chart.
- MACD (Moving Average Convergence/Divergence) indicator Fast EMA of period 12. Slow EMA period 26. SMA period 9
- Bollinger Bands. Period 20
- Non-commercial traders are speculators, such as individual traders, hedge funds, and large institutions, which use the futures market for speculative purposes and meet certain requirements.
- Long non-commercial positions represent the total long open position of non-commercial traders.
- Short non-commercial positions represent the total short open position of non-commercial traders.
- Total non-commercial net position is the difference between short and long positions of non-commercial traders.